

Data tables are a fundamental component of Salesforce, transforming users’ interactions with related records. Think of a data table as a powerful spreadsheet embedded directly within Salesforce. It lets users view, manage, and act on multiple records simultaneously. This functionality becomes particularly valuable when dealing with parent-child relationships, such as Cases and their associated Tasks.
In Salesforce, there’s often a need to display tabular data to users in an organized and interactive way. Traditional methods of showing data can be limited, especially when dealing with related records or complex data structures. In our specific case, we needed to implement a table view that would:
After evaluating the options, we implemented the data table using Screen Flow.
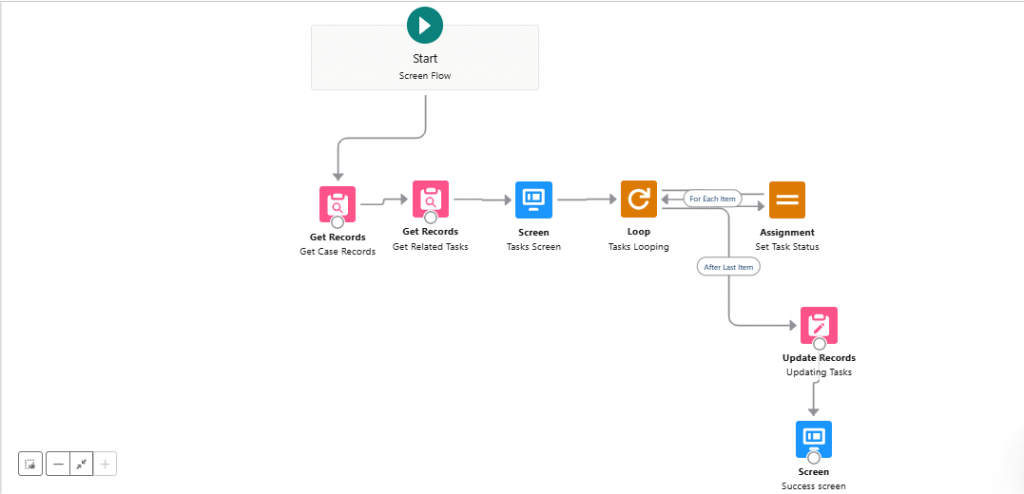
When a user clicks a button on a Salesforce case record, a well-thought-out flow behind the scenes simplifies what might otherwise be a laborious procedure, making task management a quick and easy experience. Let’s take it one step at a time:
The first step in the flow is to determine the current case. It retrieves every important aspect of the case using a Get Records element. Asking this step guarantees that the flow is aware of the context.
The flow then collects all case-related tasks using a second Get Records element. Consider this a relational query that effectively gathers the task data required for additional processing.
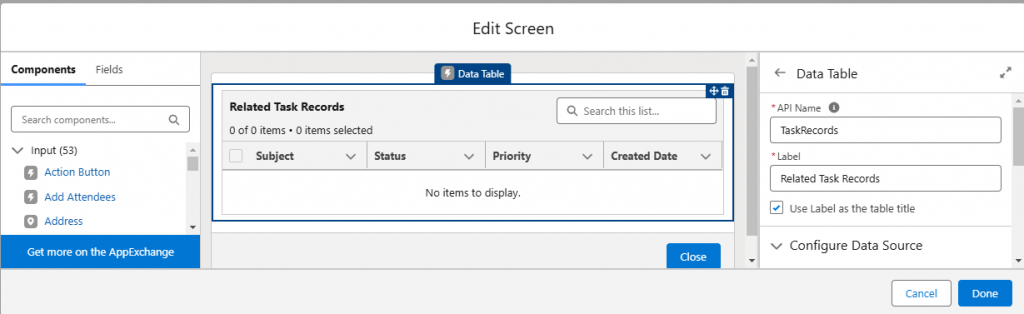
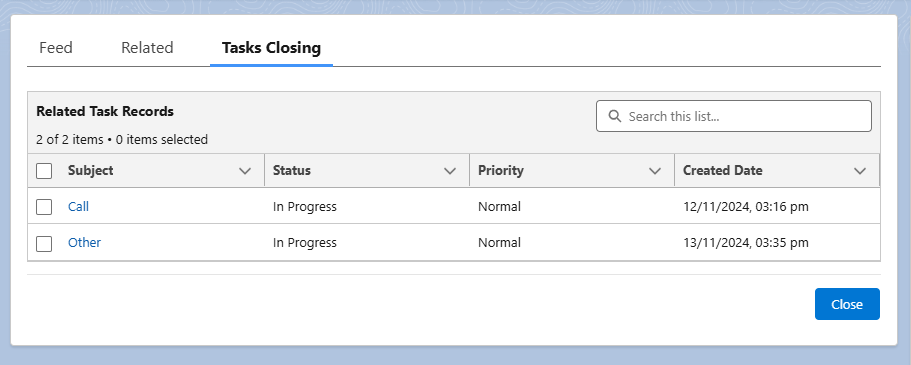
The tasks are displayed using a data table interface in a screen component. This interface serves as a central dashboard, and users can see, sort, filter, and choose which tasks to update. The intuitive layout, which resembles a spreadsheet designed for speedy decision-making, improves usage. Below is the Configuration of Data Table
Open your Screen Flow in the Flow Builder. Drag and drop a Data Table component onto the screen. Provide a Label and an API Name to identify your table. Optionally, check the box to use the label as the table’s title for easier reference during runtime.
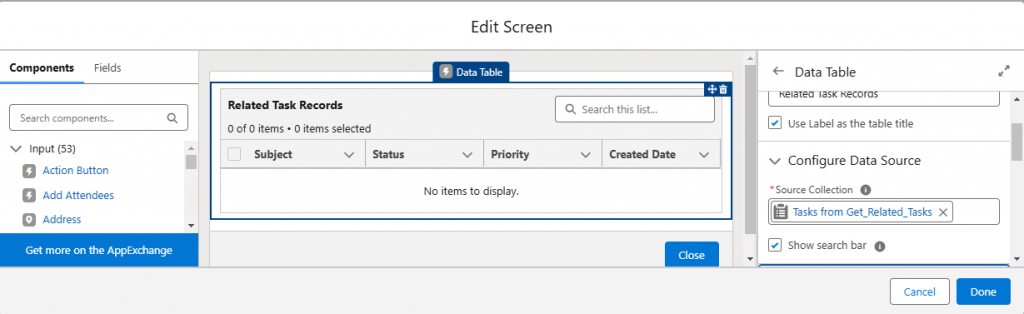
In the Collection field, choose the record collection variable that contains the records you want to display. If the collection includes many records, enable the Search Bar option to allow users to find specific records more efficiently.
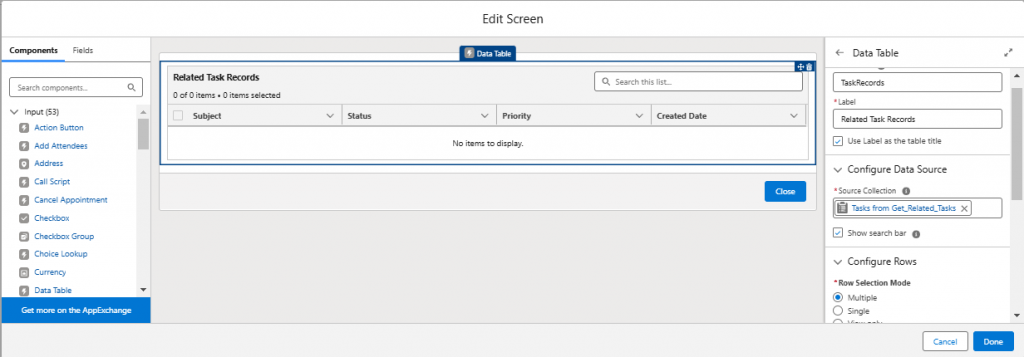
Decide how users can interact with the rows in your Data Table:
Multiple Record Selection: Allows users to select multiple records.
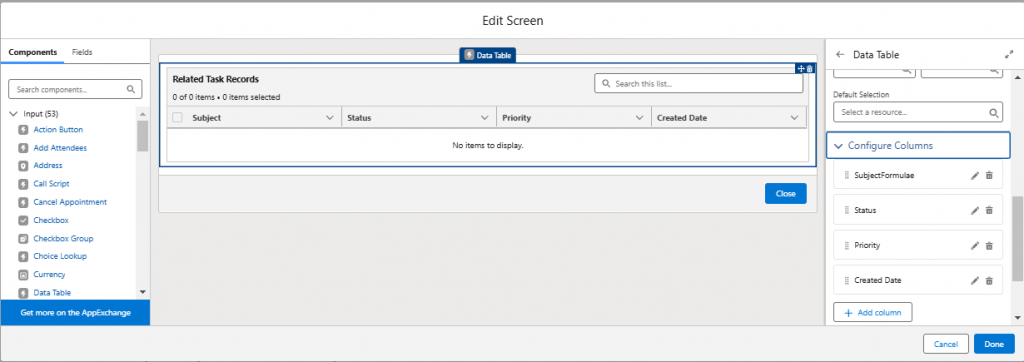
Select the fields you want to display as columns from the record collection’s source object. Customize the column labels by renaming fields. Rearrange columns to display the most important information first.
Once users select the tasks they want to update, the flow enters a loop element. This acts like a conveyor belt, iterating through each selected task systematically. An Assignment element is used for every task in the loop to set or modify field values, applying the necessary updates.
After the loop completes, the flow leverages the Update Records element to process all the changes in bulk. Instead of updating tasks individually, this bulk operation improves efficiency and minimizes processing time—akin to sending a batch email rather than handling each separately.
Finally, the flow concludes with a Success Screen that provides immediate feedback that the selected tasks have been successfully updated. This confirmation gives users the assurance they need and acts as the final checkmark on their to-do list.
Run the flow in Debug Mode to ensure that the table displays the correct records, allows the desired interactions, and performs as expected.
Workflow is a well-planned process that transforms tedious tasks into effortless ones. It’s not just about updating tasks; it’s about making work smarter and more efficient. This flow makes complex tasks appear simple while working hard to ensure smooth and accurate execution.
The Data Table component in Salesforce Flows allows users to display and interact with data collections within their flows using a table format. Users can select records for
further action or use them for a simple, read-only display. Implementing data tables in Salesforce Screen Flow bridges the gap between usability and functionality,
transforming task management into an intuitive and efficient process. This solution simplifies complex operations while maintaining Salesforce’s native look and feel. Datatables exemplify the balance of simplicity and efficiency, improving operational efficiency and fostering user satisfaction, making them an indispensable tool for modern
Salesforce solutions.
Authors: Sai Rohith Mattaparthi