Displaying standard report data in Lightning component

Displaying standard report data in Lightning component

Sometime we might end up the slow performance of showing custom charts by querying the object data- if the data is in millions. The best way to improve the performance is by creating a standard report and getting data of report to apex with ReportManager class. we can also pass the filter values based on your requirement and display charts in the Lightning component with the help of Javascript chartCanvas class.

blog-4

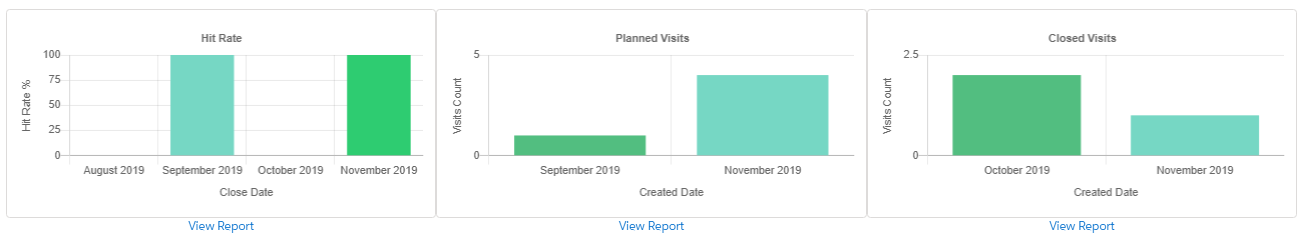
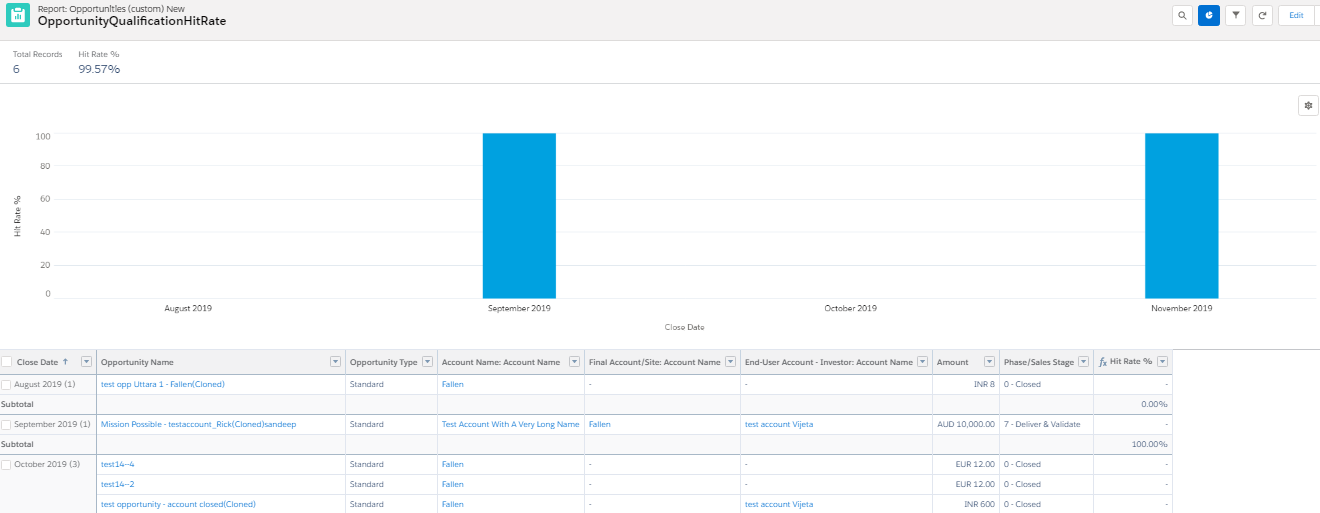
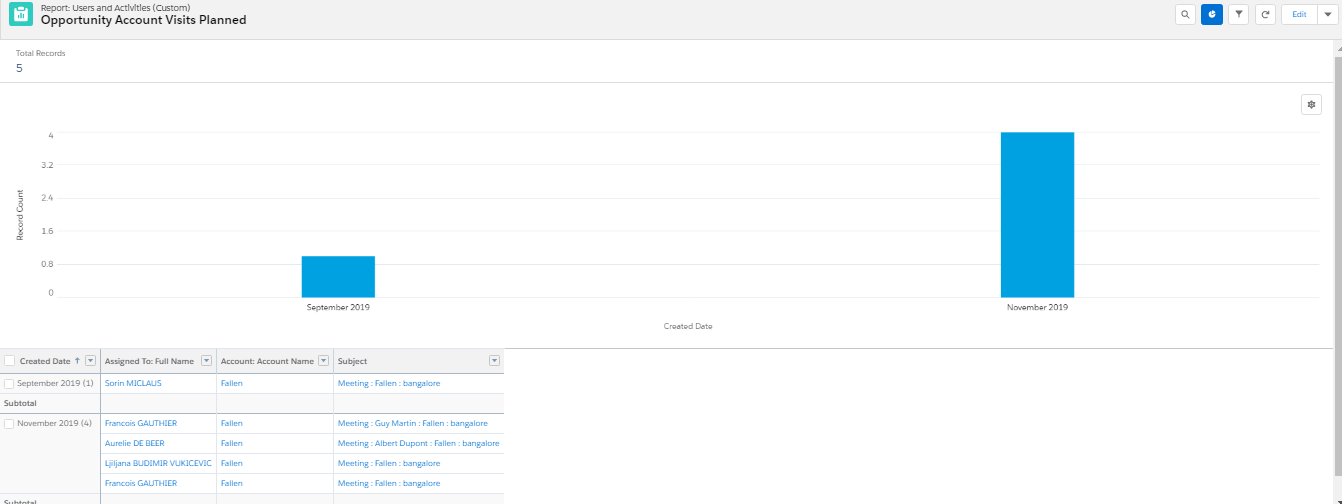
FYI : The above charts are constructed with standard reports- Matrix and Summary type.

We need to consider some standard classes.

ReportManager class helps to run a report synchronously or asynchronously.

ReportResults class contains the results of running a report.

ReportFilter class contains information about a report filter, including column, operator, and value.

and some Methods of above classes

describeReport(reportId) Retrieves report, report type, and extended metadata for a tabular, summary, or matrix report.Example:Reports.ReportDescribeResult describe =  Reports.ReportManager.describeReport(reportId);

getReportMetadata() Returns metadata about the report, including grouping and summary information.

Example:Reports.ReportMetadata reportMd = describe.getReportMetadata();

getReportFilters() Returns a list of each custom filter in the report along with the field name, filter operator, and filter value.

Example: Reports.ReportFilter filterlist = reportMd.getReportFilters()[0]; filterlist .setValue(filterId);

Apex code

@AuraEnabled
public static string Getreportplanned(String AccId){
Report repRec=[SELECT Id,Name,DeveloperName from Report where DeveloperName=:system.Label.CLNOV19SLS04];
string reportPlannedId=repRec.Id;
string filterId=String.valueOf(AccId).substring(0, 15);
// Retrieves report metadata
Reports.ReportDescribeResult describe = Reports.ReportManager.describeReport(reportPlannedId);
Reports.ReportMetadata reportMd = describe.getReportMetadata();
// Add/Override filters
Reports.ReportFilter filterlist = reportMd.getReportFilters()[0];
filterlist .setValue(filterId);
//and Run report
Reports.ReportResults reportResult = Reports.ReportManager.runReport(reportPlannedId,reportMd);
system.debug(‘ReportResultsJSON’+JSON.serialize(reportResult));
return JSON.serialize(reportResult);
}

[/sourcecode]

Aura component
To load chart on page load.
<ltng:require scripts="{!$Resource.chartjs}" afterScriptsLoaded="{!c.createPlannedchart}"/>

For displaying the report

 <canvas id="chartCanvas" height="300" width="300"></canvas>

To view standard report

[sourcecode language=”java”] View Report [/sourcecode]

Js Code 

[sourcecode language=”java”]
var urlPlannedreport = ‘/lightning/r/Report/’+getPlannedReportId+’/view?queryScope=userFolders&fv0=’+accIdsub;

createPlannedchart: function(component) {
var chartCanvas = component.find(“plannedChart”).getElement();
var action = component.get(“c.getreportplanned”);

action.setParams({
“AccId”: component.get(“v.accrecId”)
});
action.setCallback(this, function(response) {
var state = response.getState();
if (state === “SUCCESS”) {
var reportResultData = JSON.parse(response.getReturnValue());
// alert(JSON.stringify(reportResultData));
var chartData = [];
var chartLabels = [];
var nullcheck = reportResultData.groupingsDown.groupings;
if (nullcheck !== null) {
for (var i = 0; i < (reportResultData.groupingsDown.groupings.length); i++) {
//Iterate and prepare the list of Labels for the chart
var labelItem = reportResultData.groupingsDown.groupings[i].label;
chartLabels.push(labelItem);
var keyTemp = reportResultData.groupingsDown.groupings[i].key;
//Prepeare the chart data to be plotted.
var valueTemp = reportResultData.factMap[keyTemp + “!T”].aggregates[0].value;
chartData.push(valueTemp);
}
}
//Construct chart-doughnut/bar
var chart = new Chart(chartCanvas, {
type: ‘bar’,
data: {
labels: chartLabels,
datasets: [{
label: “Count”,
data: chartData,
backgroundColor: [
“#52BE80”,
“#76D7C4”,
“#1E8449”,
“#2ECC71”,
“#FFB74D”,
“#E67E22”,
“#F8C471”,
“#3498DB”,
“#00BCD4”,
“#D32F2F”,
“#82E0AA”,
“#AFB42B”
]
}]
},
options: {
responsive: true,
title: {
display: true,
text: ‘Planned Visits’
},
scales: {

yAxes: [{
ticks: {
// max: 100,
stepSize: 25,
beginAtZero: true
},
scaleLabel: {
display: true,
labelString: ‘Visits Count’
},
}],
xAxes: [{
scaleLabel: {
display: true,
labelString: ‘Created Date’
}
}]
},
maintainAspectRatio: false,
legend: {
display: false,
position: “right”,
fullWidth: false,
}
}
});

} else(state === “ERROR”) {
console.log(‘Problem, response state: ‘ + state);
}

});
$A.enqueueAction(action);
}
[/sourcecode]

You can change the look of charts with the help of chartcanvas methods.

[/vc_column_text][/vc_column][/vc_row]

Leave a Comment

Your email address will not be published. Required fields are marked *

Recent Posts

DocuSign CLM the ultimate tool for managing contracts
DocuSign CLM: The Ultimate Tool for Managing Contracts
salesforce ui design update a detailed overview
Salesforce UI Design Update: A Detailed Overview
dreamforce 2024
Dreamforce 2024: A 3-Day Event of Learning, Connection, and Inspiration
how-can-slaesforce b2b commerce cloud increase customer engagement
How Can Salesforce B2B Commerce Cloud Increase Customer Engagement
salesforce for financial services transforming customer engagement operational effectiveness
Salesforce for Financial Services: Transforming Customer Engagement & Operational Effectiveness
Document

How can i help you? close button

powered     by   ABSYZ
Scroll to Top