
There are multiple situations when we need to display a chart in our lightning component. We have seen in an earlier blog (REF), the process to use strike components to generate charts in lightning. However, in some cases we may need to display a chart grouped by certain parameters just like how we do in reports and dashboards.
The figure below shows the standard reports & Dashboards in salesforce using grouped values.
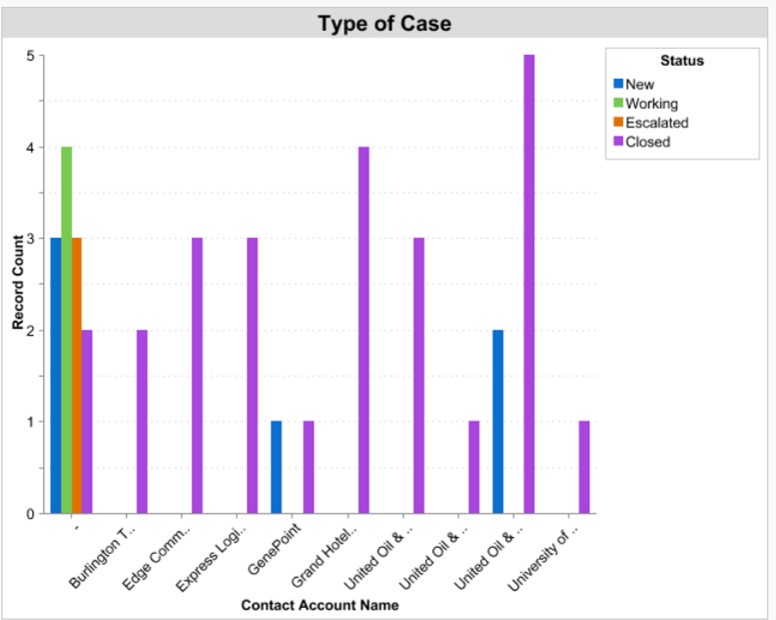
It is true that we can use reports and dashboards for this purpose. But in situations where you need to filter records based on custom criteria and then display the chart or in case you want a customized chart to be displayed in your lightning community pages, then we need to develop the chart component through code. In addition, we can greatly improve the UI of the chart in lightning.
In this blog, let’s see how to create a group bar graph component using a Strike BarGraph extension using lightning components.
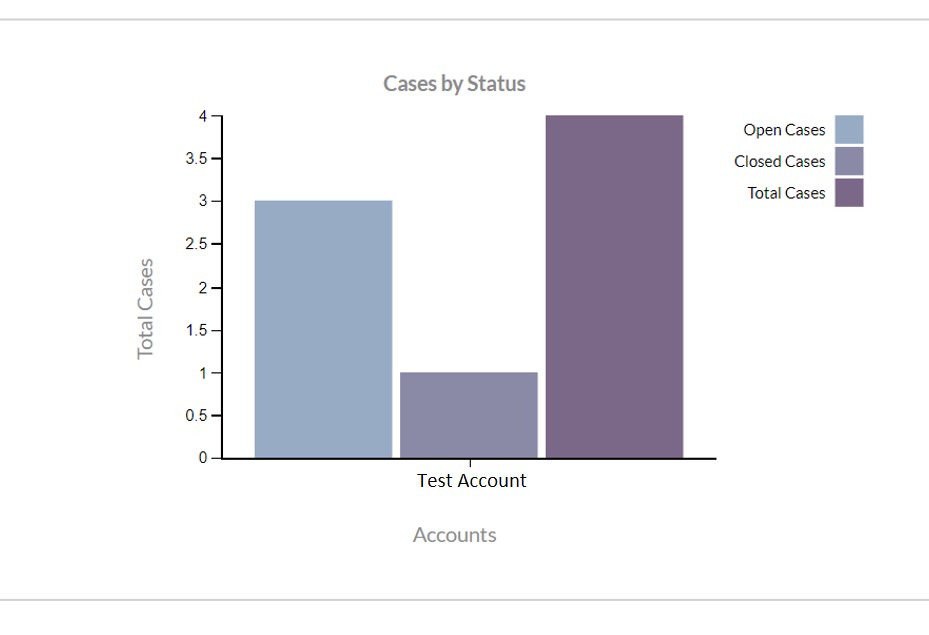
Consider a situation, where we need to display a chart of ‘No of Cases per Account’ and we need to group the cases by Case Status. Let’s say we need the number of open cases, closed cases and the total number of cases to be grouped by account (see graphical depiction below). This example is considered in the code references in this blog.
We use the below components for developing this chart:
1. LCC_CaseResults (Apex Class)
2. LCMP_StrikeChart (Lightning Component)
3. LCMP_DisplayChart (Lightning Component)
4. LAPP_DisplayChart (Lightning Application)
5. strikecomponent.js (Static Resource)
Before we start, we need to upload a js file into our static resource so that we have all necessary libraries for using the strike chart component. Follow the below steps for the same:
- Click on this link. Copy the code into a notepad and save it with Name.js extension.
- Now search for ‘static resource, on quick search bar. Click on New and upload your file here.
- Give a suitable name, I have named my static resource as StrikeCmpResource. Make sure that set the Cache Control field as ‘Public’.
Now we’re all set to start our code! Let’s begin by writing our apex code for retrieving these cases and the corresponding account. Create an apex class LCC_CaseResults.
Since we need to group the cases by account and get number of open, closed and total cases per account, we would need a wrapper class so that we can easily do the computations in the lightning controller.
[code language="html"]

global without sharing class LCC_CaseResults {

    @AuraEnabled
    public static List getAllCases() {

        LIST filteredCases = new LIST();
        LIST filteredAccounts = new LIST();
        LIST results = new LIST();
        Map recordSet = new Map();
        SET accountIds = new SET();

        //Query to retrieve your cases
        //This is a generic query and you can filter it based on your requirement
        filteredCases = [SELECT Id, CaseNumber, toLabel(Status), Account.Name, AccountId from Case
                         where AccountId!='' LIMIT 999];

        for(Case record : filteredCases) {
            recordSet.put(record.id, record);
            accountIds.add(record.AccountId);
        }

//Query to retrieve related accounts
        filteredAccounts =[Select id, name from account where id IN:accountIds LIMIT 2];
        filteredCases = new LIST();
        filteredCases.addAll(recordSet.values());

        CaseViewResults record = new CaseViewResults();
        record.cases = filteredCases;
        record.accounts = filteredAccounts;
        results.add(record);
        return results;
    }

    //Wrapper class
    public class CaseViewResults {
        @AuraEnabled public LIST accounts;
        @AuraEnabled public LIST cases;
        public CaseViewResults() {}
    }
}
[/code]
Now that our controller is ready, let’s create our lightning component. We need to create a component that will use strike resources and build a chart. Click on the below links to access the code of the components. You can find the detailed explanation of the code in the comments of the code.
- LCMP_StrikeChart.cmp
- LCMP_StrikeChartController.js
- LCMP_StrikeChartHelper.js
- LCMP_StrikeChart.css
- LCMP_StrikeChartRenderer.js
We now have the strike component ready. We need to write a parent lightning component which passes the values to the Strike component based on our criteria.
Click on the below links to access the code of the component:
Now that our components are ready, let’s create a Lightning Application, LAPP_DisplayChart to display the chart:
[sourcecode language="java"]
 <aura:application extends="force:slds">
 <c:LCMP_DisplayChart />
</aura:application>
[/sourcecode]
In case you want to use your chart in lightning community page say Napilli Template, follow the below steps to add this component on your page:
- Open your community builder and open the required page where you want to disply your chart
- Click on component (the lightning icon on the top-left) and drag and drop the LCMP_DisplayChart component onto your page
The following is the output of the chart:
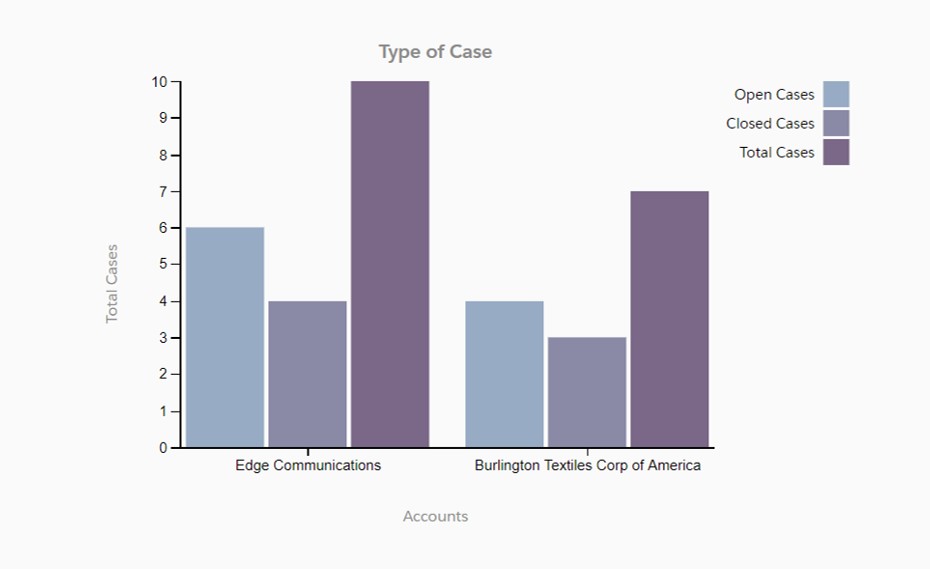
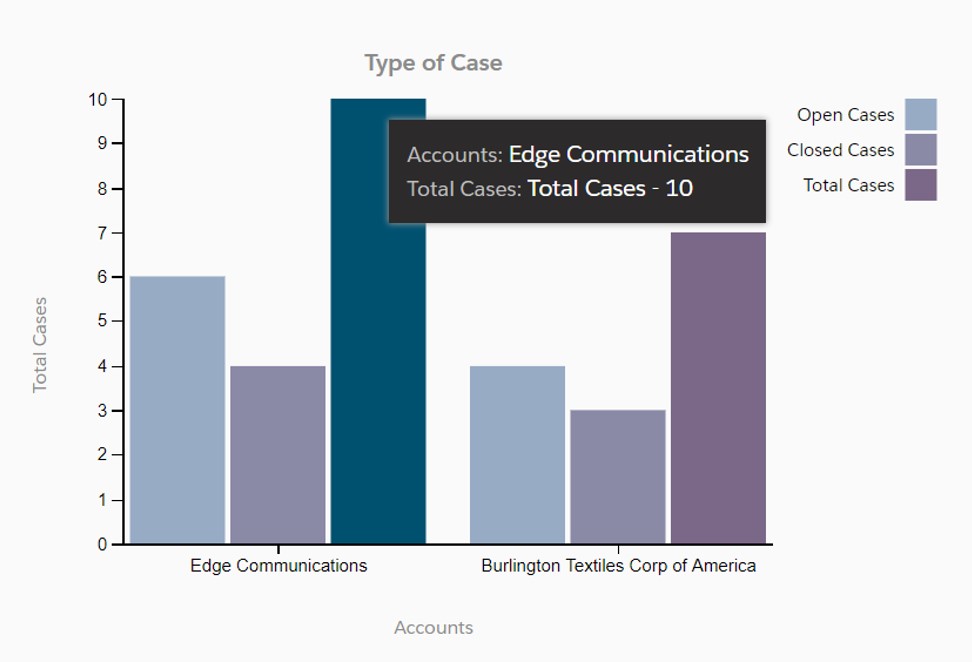
As you can see, the cases are getting grouped based on their status by account. On hovering over each bar, we get the following help-text as well:
The advantages of using this chart is as follows:
1) The axis resizes itself based on the count of cases without causing any visual imperfections.
2) Depending of the number of accounts, the graph extends itself to accommodate new values.
3) We can customize the graph colors, hover text and the titles for the axis as well.
4) The code here uses best practices and many generic methods which can be implemented in all our lightning code to increase the performance. A good example is the generic method for making server calls (see github code of controllers & helpers)
Cons:
1) If the number of values in the x axis increases beyond 5, the x-axis becomes crowded and the UI looks congested.
2) If he number of values in the x axis is beyond 5 and the labels for the x-axis fields are long texts, they may not wrap appropriately based on the label and the names tend to overlap.
Happy Coding!!


1 thought on “Grouped Bar Graph In Lightning Using Strike Bar Graph Component Extension”
https://drive.google.com/file/d/19atN1Y-mfErBWHPF0YUh5oDxAwsFN5jI/
ad6d318fbc goomel