Motivation: When you can’t build the desired chart using Visualforce, you can use the vast Google Charts API.
What is Gantt Chart:
A Gantt chart is one of the most popular and useful ways of showing activities (tasks or events) displayed against time.On the left of the chart is a list of the activities and along the below is a suitable time scale. Each activity is represented by a bar; the position and length of the bar reflect the start date, duration and end date,dependencies of the activity.This allows you to see at a glance:
• To know which activities are interrelated
• When each activity begins and ends
Does that mean we cannot use Gantt Chart in Salesforce?
No, the following article shows one of the easiest ways to build Gantt Chart with the help of Google Charts.
Technologies Used: Apex class, Visualforce, Google Gantt chart and JavaScript.
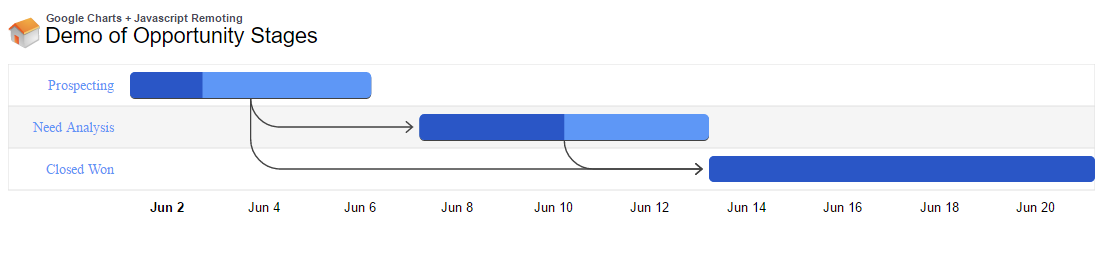
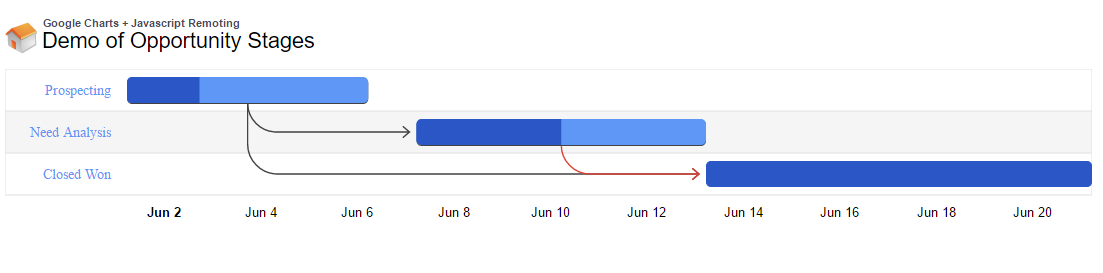
Consider an example of Opportunity stages where stages will be changed one after the other after the certain end time.Sometimes there may be chances of a direct move from the first stage to last as shown below.
To display dependency arrow you need to mention the dependency name while saving the record value.
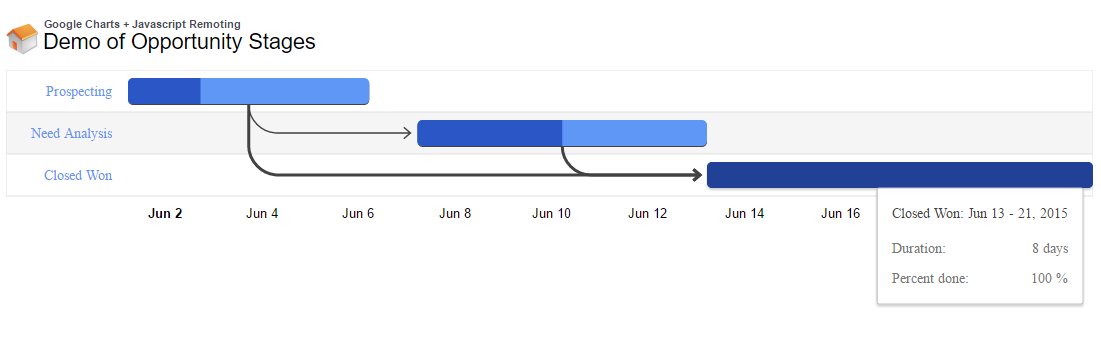
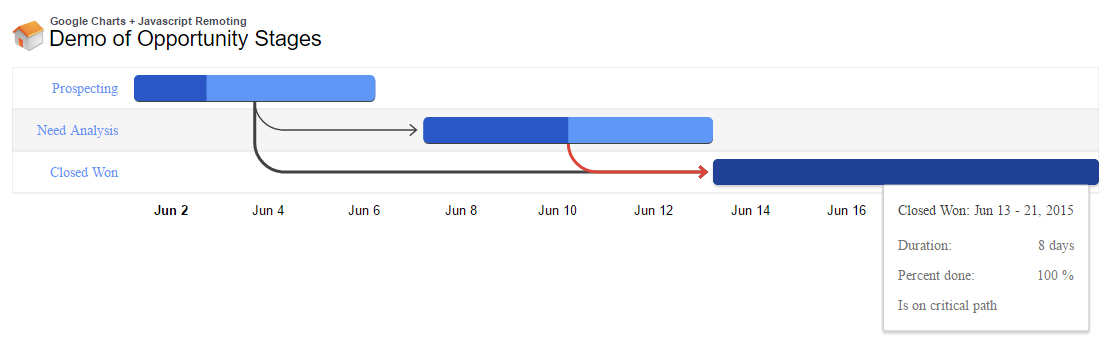
If you hover on graph bar, respective bar details will be shown.
How to customize critical path in Gantt Chart?
The critical path in a Gantt chart is the path, or paths, that directly affect the finish date. The critical path in Google Gantt charts is colored red by default, and can be customized using the criticalPathStyle options. You can also turn off the critical path by setting criticalPathEnabled to false.
Critical path in Visualforce
[code language=”css”]
var options = {
height: 275,
Gantt: {
criticalPathEnabled:true //By default it will be true
}
};
[/code]
 If you hover on graph bar, respective bar details will be shown.
We can also customize the charts based on certain attributes. For more detail refer Google charts for- Gantt Chart.
Controller Code:
We will pass a list of opportunities which are queried in controller method to javaScript function written in visualforce page using RemoteAction.
[sourcecode language=”html”]
global with sharing class googlegantchart {
public String oppList { get; set; }
@RemoteAction
global static Opportunity[] loadrecords() {
return [select Name,Task_Id__c,Task_Name__c, Start_Date__c, End_Date__c,Duration__c,Dependencies__c,Percent_Complete__c from opportunity where Task_Id__c!=Null];
}
}
[/sourcecode]
VisualForce Code:
We will set the way of displaying data as Gantt manner by using Google.charts.load( ‘current’, { ‘packages’: [‘gantt’]}) method. Google.charts.setOnLoadCallback(InitCharts) method is used to call the javascript method ‘InitCharts’. Javascript function ‘InitCharts’ in our execution calls the controller method and stores the result in result variable. We will pass this data to load function which will display the result in Gantt chart Manner.
[sourcecode language=”html”]
<apex:page controller=”googlegantchart”>
<apex:includeScript id=”a” value=”https://www.google.com/jsapi” />
<apex:sectionHeader title=”Google Charts + Javascript Remoting” subtitle=”Demo of Opportunity Stages” />
<div id=”chart_div” />
<script type=”text/javascript” src=”https://www.gstatic.com/charts/loader.js”></script>
<script type=”text/javascript”>
<!–loads the visualization in gant chart view–>
google.charts.load(‘current’, { ‘packages’: [‘gantt’]});
google.charts.setOnLoadCallback(InitCharts);
function InitCharts() {
<!– calls the function called ‘loadrecords’ in googlegantchart controller–>
googlegantchart.loadrecords(
<!– following the usual remoting syntax–>
function(result, event) {
var visualization = new google.visualization.Gantt(document.getElementById(‘chart_div’));
<!–adding data to Chart–>
var data = new google.visualization.DataTable();<!– variable declaration–>
data.addColumn(‘string’, ‘Task ID’);
data.addColumn(‘string’, ‘Task Name’);
data.addColumn(‘date’, ‘Start Date’);
data.addColumn(‘date’, ‘End Date’);
data.addColumn(‘number’, ‘Duration’);
data.addColumn(‘number’, ‘Percent Complete’);
data.addColumn(‘string’, ‘Dependencies’);
for (var i = 0; i < result.length; i++) {
var r = result[i];
data.addRow([/vc_column_text][/vc_column][/vc_row][vc_row nav_skin=”light” consent_include=”include”][vc_column css_animation=””][vc_column_text][r.Task_Id__c, r.Task_Name__c, new Date(r.Start_Date__c), new Date(r.End_Date__c), r.Duration__c,r.Percent_Complete__c,r.Dependencies__c][/vc_column_text][/vc_column][/vc_row][vc_row nav_skin=”light” consent_include=”include” el_class=”blog-page-content”][vc_column css_animation=””][vc_column_text]);
}
var options = {
height: 275,
gantt: {
criticalPathEnabled:true
}
};
visualization.draw(data, options);<!– draws a table that contains the result of data–>
},{escape:true});
}
</script>
</apex:page>
[/sourcecode]
Summary:
Gantt Chart gives you a visual of the current status of your project/task compared to what was originally planned. It also shows you the dependencies between tasks. If your plans need to be changed, you can add tasks, edit existing ones, and set new dependencies right here.
Related Links