
In Einstein Analytics we can create a lens and dashboard with the dataset available in your analytics studio. You have a dataset that is created from the dataflow which is scheduled every hour to update the dataset. Here your dataset might not have the updated data for every second or minute. What if you want to get the live data from Salesforce or any external system or handling complex solution when it is not possible in analytics to be shown on your dashboard. Using the apex step type in Dashboard JSON we can achieve displaying the manipulated data or real-time data.
Using SOQL from Dashboard
Scenario 1: The user wanted to show the real-time data from salesforce on the analytics dashboard. It is simple to achieve, just follow the steps mentioned. So we create an apex step in the dashboard and using ‘@restresource’ in apex call we fetch the data to the dashboard. Create an apex class as AnalyticsDashboardStep with restResource name as accountdata. Define a @HttpPost method that will return the value to the dashboard JSON. So your code will look as shown below.
@RestResource(urlMapping='/accountdata')
global with sharing class AnalyticsDashboardStep {
    @HttpPost
    global static String fetchAccount(String selectedIndustry) {
         //selectedIndustry - attribute value passed from the analytics Dashboard
         //return the output
    }
}
Define a wrapper that parses the data to the dashboard JSON. The WrappedData wrapper creates a mapping between the parameters defined and the queried fields of account. The ReturnMetadata wrapper is to define the data type for each returned column. The ChartFormatJSON wrapper is to combine the data(rows) and header(columns).
    public class WrappedData{
        public String Account_Name;
        public String Account_Id;
        public String Account_Industry;
        public String Account_AccountSource;
        public Decimal Account_AnnualRevenue;
        public WrappedData(){}
        public WrappedData(Account data){
            this.Account_Name = data.name;
            this.Account_Id = data.Id;
            this.Account_Industry = data.Industry;
            this.Account_AccountSource = data.AccountSource;
            this.Account_AnnualRevenue = data.AnnualRevenue;
        }
    }
    public class ReturnMetadata {
        public List<String> strings; // columns that return as text
        public List<String> numbers; // columns that return as numeric
        public List<String> groups;  // columns that return as groups
        public ReturnMetadata(List<String> strings, List<String> numbers, List<String> groups) {
            this.strings = strings;
            this.numbers = numbers;
            this.groups = groups;
        }
    }
    public class ChartFormatJSON {
        public List<WrappedData> data;
        public ReturnMetadata metadata;
        public ChartFormatJSON(List<WrappedData> data) {
            this.data = data;
            this.metadata = new ReturnMetadata(new List<String>{'Account_Id','Account_Name','Account_Industry'},
                                                new List<String>{'Account_AnnualRevenue'}, new List<String>{'Account_Name'});
        }
    }
Since your wrapper parameters are set up, now pass the values in the @HttpPost fetchAccount method as stated above. In the below method we have a queried List of accounts as a return statement to the Dashboard. For the complete class check this link.
    @HttpPost
    global static String fetchAccount(String selectedIndustry) {
        List<Account> dataDisplay = new List<Account>();
        List<WrappedData> wrpData = new List<WrappedData>();
        // If the Industry is not selected from the interaction step
        if (selectedIndustry == null) {
            dataDisplay = [select Id,Name,Industry,AnnualRevenue,AccountSource from account order by AnnualRevenue desc];
        }else{
            dataDisplay = [select Id,Name,Industry,AnnualRevenue,AccountSource from account where industry=:selectedIndustry order by AnnualRevenue desc];
        }
        for(Account acc : dataDisplay){
            wrpData.add(new WrappedData(acc));
        }
        //Serialize the wrapper that you have created with account data
        return JSON.serialize(new ChartFormatJSON(wrpData));
    }
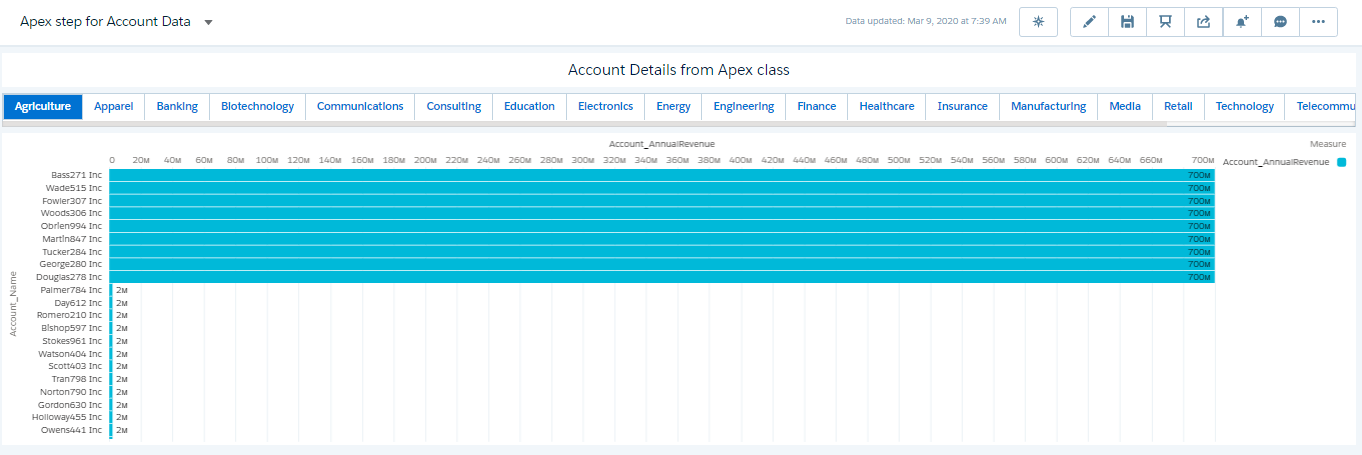
Once your apex class is ready, move to the analytics studio to create a dashboard with an apex step. Create a toggle with filter values as Account Industry. Follow the below steps to create a dashboard. In the new dashboard if you have completed the above steps, click ctrl + E in windows or command + E in Mac to edit your Dashboard JSON. Add the apex step as shown below. The GetChartData is the query name in the dashboard. In the query parameter, you set the body value as an apex input parameter named selectedIndustry that holds the value selected from the dashboard. Define the apex class name in the path parameter and apex in the type parameter.
"GetChartData": {
	"query": {
		"body": {
			"selectedIndustry": "Agricultrue"
		},
		"path": "accountdata"
	},
	"type": "apex"
},
If you want to pass the selected industry value dynamically then use interaction syntax that can be generated from the advance editor of the GetChartData query. Edit your query value with “{{cell(Industry_1.selection, 0, “Industry”).asString()}}” to pass the value dynamic. You can use both Result or Selection type of interaction.
"GetChartData": {
     "query": {
          "body": {
                "selectedIndustry": "{{cell(Industry_1.selection, 0, "Industry").asString()}}"
          },
          "path": "accountdata"
     },
     "type": "apex"
},
Click on Done after completing the JSON edit. You can see the GetChartData query in the query list on your right-hand side of the dashboard. Drag the query to the dashboard building area. To get the full dashboard JSON click here.
Dashboard Output:
REST API call from Dashboard
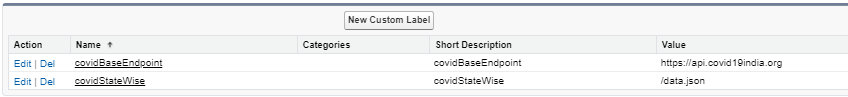
Scenario 2: Similarly, the user wanted to show the live updates from an external system to your analytics dashboard, then we do an apex REST API call to fetch the details whenever the dashboard is loading or refreshing. Here we have taken an example of COVID ’19 to show the number of updated cases in India. So we are using https://api.covid19india.org API to fetch the COVID updated details. Similarly, you can choose your API according to your necessity. It is similar to scenario 1, whereas here we are creating an apex class with REST API callout and passing the parameters in the same format that is required for the dashboard. Add the URL in remote site settings. Create two custom labels with the details mentioned below:
- Custom Label 1
- Name: CovidBaseEndpoint
- Value: https://api.covid19india.org/
- Custom Label 2
- Name: CovidStateWise
- Value: /data.json
The next step is to create an apex class to make an Http request and get the response. The getStateWiseData method makes an API request and is serialized to the dashboard through the data_val method. Notice PackagedReturnItem wrapper where we have categorized the columns as a string, number, and group in ReturnMetadata.
@RestResource(urlMapping='/covid')
global with sharing class CovidData {
    @HttpPost  // Annotation Specified to highlight that this method needs to be called.
    global static String data_val() {
    	CovidStatusCoreData1 data = getStateWiseData();
        return JSON.serialize(new PackagedReturnItem(data.statewise));
    }

    public static CovidStatusCoreData1 getStateWiseData() {
        String BaseEndpoint = System.Label.covidBaseEndpoint; //Retrieve the endpoint and statewise variable from custom label
        String StateWise = System.Label.covidStateWise;
        HttpResponse resp = makeAPICallout(BaseEndpoint,StateWise);
        CovidStatusCoreData1 response = (CovidStatusCoreData1)System.JSON.deserialize(resp.getbody(), CovidStatusCoreData1.class);
        if (response != null) {
            return response;
        }
        return null;
    }
    public static HttpResponse makeAPICallout(String BaseEndpoint,String StateWise) {
        Http h = new Http();			//Make a request with the parameters set
        HttpRequest req = new HttpRequest();
        String endpoint = BaseEndpoint + StateWise;
        req.setEndpoint(endpoint);
        req.setMethod('GET');
        HttpResponse res = h.send(req);		// Send the request, and return a response
        if (res.getStatusCode() == 200 ) {
            return res;
        }
        return null;
    }
    public class ReturnMetadata {
        public List<String> strings;
        public List<String> numbers;
        public List<String> groups;
        public ReturnMetadata(List<String> strings, List<String> numbers, List<String> groups) {
            this.strings = strings;
            this.numbers = numbers;
            this.groups = groups;
        }
    }
    public class PackagedReturnItem {
        public List<StateWiseData> data;
        public ReturnMetadata metadata;
        public PackagedReturnItem(List<StateWiseData> data) {
            this.data = data;
            this.metadata = new ReturnMetadata(new List<String>{'state','statecode','lastupdatedtime'},
                                               new List<String>{'active','recovered','deaths','confirmed','deltaconfirmed','deltadeaths','deltarecovered'},
                                               new List<String>{'state'});
        }
    }
    public class CovidStatusCoreData1 {
        public List<DailyKeyValues> key_values;
        public List<StateWiseData> statewise;
    }
    public class DailyKeyValues {
        public String confirmeddelta;
        public String counterforautotimeupdate;
        public String deceaseddelta;
        public String lastupdatedtime;
        public String recovereddelta;
        public String statesdelta;
    }
    public class StateWiseData {
        public Integer active;
        public String confirmed;
        public String deaths;
        public String recovered;
        public String state;
        public String statecode;
        public String lastupdatedtime;
        public String deltaconfirmed;
        public String deltadeaths;
        public String deltarecovered;
    }
}
Create an apex step GetChartData in dashboard JSON to display the data. After placing the apex step click on done from the dashboard. Place the query on top of the table widget as shown below.
"GetChartData": {
	"query": {
		"body": {},
		"path": "covid"
	},
	"type": "apex"
},
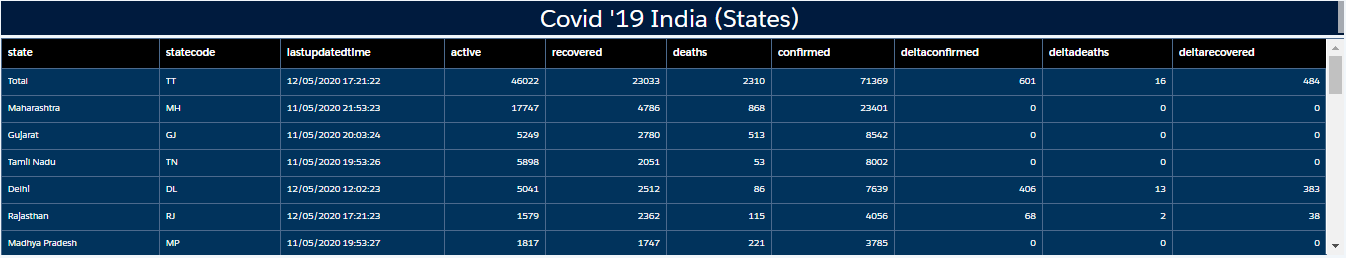
In the final step, we have created a Static step to filter by states in India. To show a different type of output chart in the dashboard pass the wrapper from the apex class. Set the ReturnMetadata string, number, and group by columns correctly so that you could see the correct output when you place the query in the chart widget. Likewise, create the apex classes to fetch the data and display it in different chart types as shown in the below dashboard. Refer to the link for the apex classes and dashboard JSON. Using the dashboard inspector we can check the output for each lens that helps us to identify the performance and time taken for the query. Click on show details for a query that will show the details on your right-hand side panel. There you go! you are on the last step to verify your dashboard, check the clip below.
NOTE: When you work with API apex step in analytics dashboard remember you have certain limits provided by salesforce that you can refer here. Firstly, Maximum concurrent Analytics API calls per org limit as 100. Secondly, Maximum Analytics API calls per user per hour limit as 10,000.