
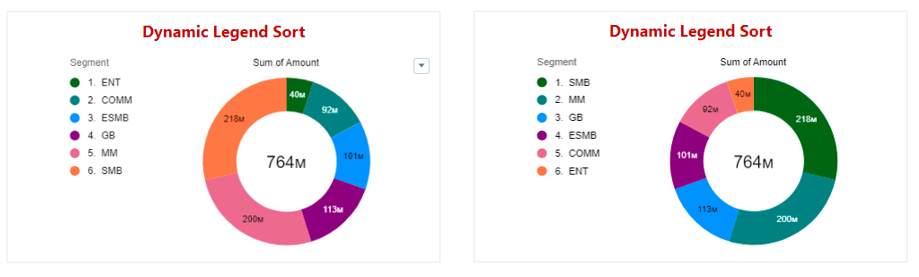
Tableau CRM provides a default option to sort Chart Legends by Ascending or Descending. But what if a user wants to see the category types on legend, sorted based on the revenue. Follow the simple steps to control the Legend view. We will be able to sort the Legends based on measure values and also set the color dynamically as shown below.
Create a Chart
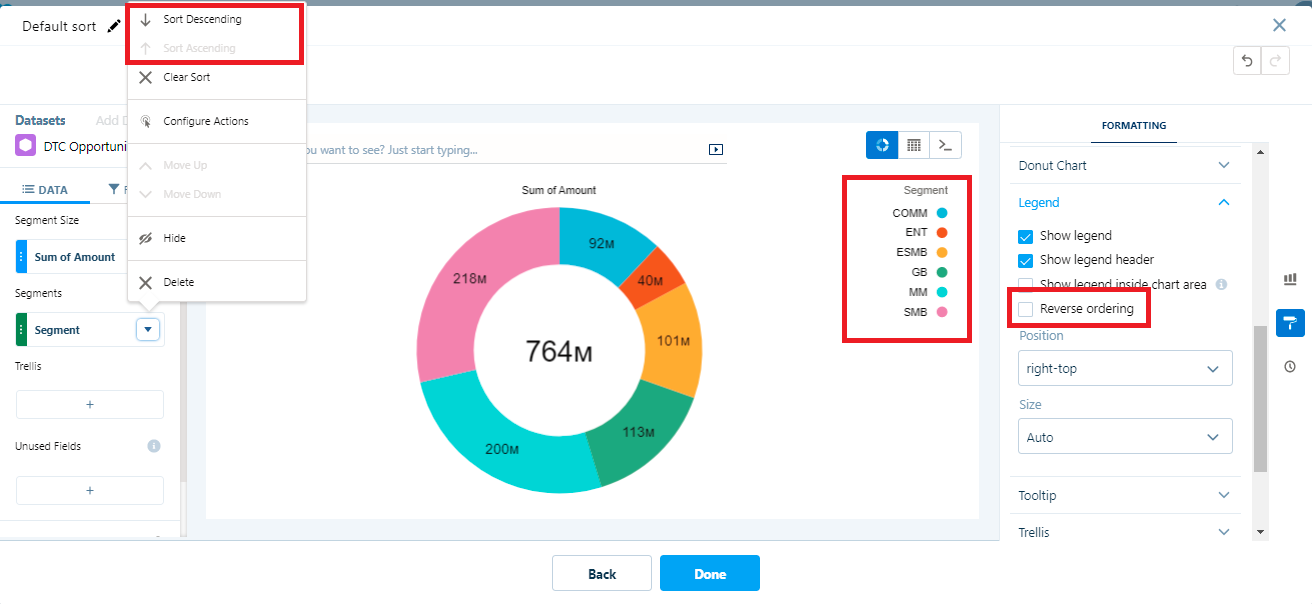
Create a Donut chart type choosing the segment and segment size. By default, you will be able to sort the Donut by Segment size as asc / desc and Segment as asc / desc. As shown below
We want to show the legends based on the amount sort. To begin with edit the chart in SAQL mode. Add a query statement to rank the segment based on amount. As shown below in the foreach, we sort the order by Opportunity Amount, Opportunity Segment field and concatenate the rank with segment label.
foreach q generate number_to_string(rank() over([..] partition by all order by (sum(‘Amount’) desc, ‘Segment’ asc)), “#”) + “. ” + ‘Segment’ as ‘Segment’, sum(‘Amount’) as ‘sum_Amount’
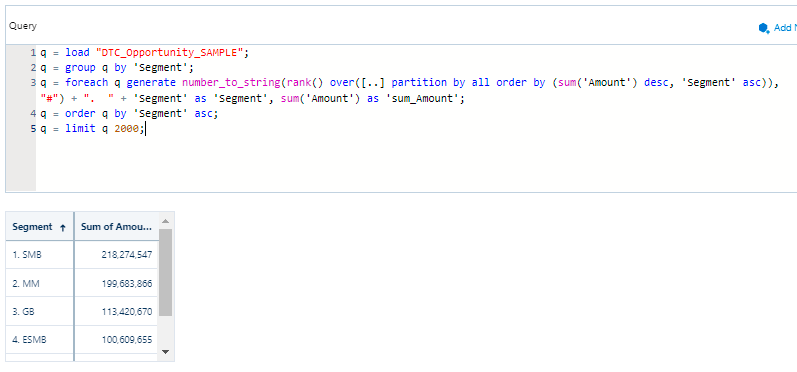
Once you run the query, change the view to chart mode. The chart is ready with the legend sort. Place the chart query on the dashboard and save it.
Edit the Dataset XMD
We need to set the color for the legends in the xmd. Here we will set the order of the color.
For example, Highest amount group as green and lowest as orange.
Download the XMD file for the dataset that we are using it to create the chart.

Edit the DTC Opportunity Dataset. You will be navigated to this page. Click on download Extended Metafile file from right corner.
Edit the xmd file. Under dimensions if it is empty, add the extra code to edit the Opportunity Segment field.
“dimensions”: [
{
“conditionalFormatting”: {},
“customActions”: [],
“field”: “Segment”,
“label”: “Segment”,
“members”: [],
“recordDisplayFields”: [],
“salesforceActions”: []
}
],
In coditionalFormatting attribute we should add the combination of the legends that we generate. Click here for the dataset xmd code.
“conditionalFormatting”: {
“chartColor”: {
“parameters”: {
“values”: [
{
“formatValue”: “#006400”,
“value”: “1. COMM”
},
{
“formatValue”: “#008080”,
“value”: “2. COMM”
},
{
“formatValue”: “#1E90FF”,
“value”: “3. COMM”
},
{
“formatValue”: “#800080”,
“value”: “4. COMM”
},
{
“formatValue”: “#DB7093”,
“value”: “5. COMM”
},
{
“formatValue”: “#FF7F50”,
“value”: “6. COMM”
},
{
“formatValue”: “#006400”,
“value”: “1. ENT”
},
…….. [to be continued]
After all the changes save the xmd file. Replace the file from where you have downloaded. [On the dataset edit page top-right corner under extended metadata file]