
Lightning offers advantage over classic that it allows a lot of client processing thus saving the server side actions. One of the scenarios that I would like to cover is parsing CSV file and generating reports from the data fetched without any server side actions.
Let us consider, I have a CSV file (comma separated ) that contains information about students who play different sports in different age groups.
Let us first learn how to generate a Donut Chart in a lightning component to depict the count of the number of students playing different sports.
Download the d3.js file from https://d3js.org/d3.v4.js and upload as a static resource in your Salesforce Org. D3.js a JavaScript library used for visualization purpose. D3 can be used right from generating HTML tables to bar graphs.
Now let’s get started with the lightning component.
This blog will demonstrate how to:
- Parse a CSV file
- Generate a Donut Chart
- Generate a Grouped Bar chart
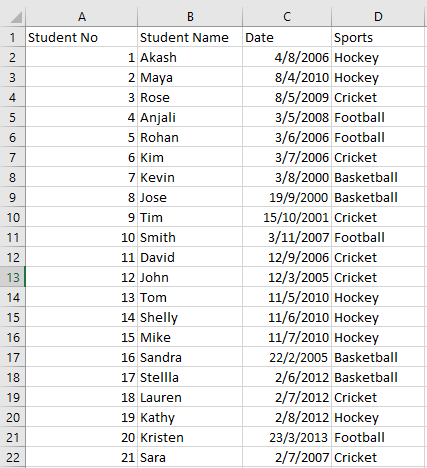
Generate a CSV file based on your requirement. Consider a file as shown below:
First we will parse the CSV file, to generate the required format necessary for generating a Donut Chart.
We will calculate the count of student playing different sports.
[sourcecode language=”java”]
<aura:component implements=”force:appHostable, flexipage:availableForAllPageTypes, flexipage:availableForRecordHome, force:hasRecordId, forceCommunity:availableForAllPageTypes, force:lightningQuickAction” access=”global”>
<ltng:require scripts=”/resource/lodash/lodash/lodash.js” />
<ltng:require scripts=”{!$Resource.d3}” />
<div class=”scroll” style=”width:100%”>
<div style=”padding-right:5%”>
<!– csv file input –>
<lightning:input type=”file” label=”” name=”Mapping” multiple=”false” accept=”.csv” onchange=”{!c.readCSV}” /></div>
<div style=”width:960px” class=”slds-scrollable” id=”chart”></div>
<div style=”width:960px” class=”slds-scrollable” id=”piechart”></div>
</div>
</aura:component>
[/sourcecode]
Controller.js
[sourcecode language=”java”]
({
readCSV: function(component, event, helper) {
var filename = event.getSource().get(“v.files”);
var textdata;
var reader = new FileReader();
var infolst = [];
reader.onload = function() {
var text = reader.result; /*Get the data stored in file*/
console.log(reader.result.substring(0, 200));
console.log(‘Data from CSV file’ + text);
textdata = text;
var rows = textdata.split(‘n’); /*Spilt based on new line to get each row*/
console.log(‘File header’ + rows[0]);
component.set(“v.showSpinner”, false);
/* Ignore the first row (header) and start from second*/
for (var i = 1; i <span data-mce-type=”bookmark” id=”mce_SELREST_start” data-mce-style=”overflow:hidden;line-height:0″ style=”overflow:hidden;line-height:0″ ></span>< rows.length; i = i + 1) {
console.log(‘Length’, +rows.length); //total number of rows in the file including header
/*Spilt based on the comma*/
var cells = rows[i].split(‘,’);
console.log(‘One row’ + cells);
console.log(‘Row length’ + cells.length);
if(cells.length!=1){
var sports=cells[3].split(‘r’);
var cellinfo = {
‘StudentNo’: cells[0],
‘Name’: cells[1],
‘Date’: cells[2],
‘Sports’: sports[0],
};
infolst.push(cellinfo);
component.set(“v.data”,infolst);
}
}
helper.generatechartdata(component);
};
if (filename[0] !== undefined && filename[0] !== null && filename[0] !== ”) {
reader.readAsText(filename[0]);
}
},
[/sourcecode]
Helper.js
[sourcecode language=”java”]
({
displaydata: function(component, data) {
d3.select(“#chart”)
.select(“svg”)
.remove();
var margin = {
top: 20,
right: 20,
bottom: 30,
left: 40
},
width = 800 – margin.left – margin.right,
height = 200 – margin.top – margin.bottom;
var x0 = d3.scaleBand()
.rangeRound([0, width]);
var x1 = d3.scaleBand();
var y = d3.scaleLinear()
.rangeRound([height, 0]);
var xAxis = d3.axisBottom(x0)
.tickSize(0);
var yAxis = d3.axisLeft(y);
var color = d3.scaleOrdinal()
.range([“#CD853F”, “#6A5ACD”, “#2F4F4F”, “#6B8E23”]);
var svg = d3.select(‘#chart’)
.append(“svg”)
.attr(“width”, width + margin.left + margin.right)
.attr(“height”, height + margin.top + margin.bottom)
.append(“g”)
.attr(“transform”, “translate(” + margin.left + “,” + margin.top + “)”);
var categoriesNames = data.map(function(d) {
return d.type;
});
var rateNames = data[0].values.map(function(d) {
return d.agerange;
});
console.log(categoriesNames);
x0.domain(categoriesNames);
x1.domain(rateNames)
.range([0, x0.bandwidth()]);
y.domain([0, d3.max(data, function(categorie) {
return d3.max(categorie.values, function(d) {
return d.count;
});
})]);
svg.append(“g”)
.attr(“class”, “x axis”)
.attr(“transform”, “translate(0,” + height + “)”)
.call(xAxis);
svg.append(“g”)
.attr(“class”, “y axis”)
.style(‘opacity’, ‘0’)
.call(yAxis)
.append(“text”)
.attr(“transform”, “rotate(-90)”)
.attr(“y”, 6)
.attr(“dy”, “.71em”)
.style(“text-anchor”, “end”)
.style(‘font-weight’, ‘bold’)
.text(“Value”);
svg.select(‘.y’)
.transition()
.duration(500)
.delay(1300)
.style(‘opacity’, ‘1’);
var slice = svg.selectAll(“.slice”)
.data(data)
.enter()
.append(“g”)
.attr(“class”, “g”)
.attr(“transform”, function(d, i) {
console.log(i);
console.log(x0(d.type));
var s = x0(d.type) + 15 * i;
return “translate(” + s + “,0)”;
});
slice.selectAll(“rect”)
.data(function(d) {
return d.values;
})
.enter()
.append(“rect”)
.attr(“width”, x1.bandwidth())
.attr(“x”, function(d) {
return x1(d.agerange);
})
.style(“fill”, function(d) {
return color(d.agerange)
})
.attr(“y”, function(d) {
return y(0);
})
.attr(“height”, function(d) {
return height – y(0);
})
.on(“mouseover”, function(d) {
d3.select(this)
.style(“fill”, d3.rgb(color(d.agerange))
.darker(2));
})
.on(“mouseout”, function(d) {
d3.select(this)
.style(“fill”, color(d.agerange));
});
slice.selectAll(“rect”)
.transition()
.delay(function(d) {
return Math.random() * 1000;
})
.duration(1000)
.attr(“y”, function(d) {
return y(d.count);
})
.attr(“height”, function(d) {
return height – y(d.count);
});
//Legend
var legend = svg.selectAll(“.legend”)
.data(data[0].values.map(function(d) {
return d.agerange;
})
.reverse())
.enter()
.append(“g”)
.attr(“class”, “legend”)
.attr(“transform”, function(d, i) {
var h = (i * 20) – 20;
return “translate(20,” + h + “)”;
})
.style(“opacity”, “0”);
legend.append(“rect”)
.attr(“x”, width – 10) //18
.attr(“width”, 10) //18
.attr(“height”, 10) //18
.style(“fill”, function(d) {
return color(d);
});
legend.append(“text”)
.attr(“x”, width – 10) //18
.attr(“y”, 5) // 9
.attr(“dy”, “.35em”)
.style(“text-anchor”, “end”)
.text(function(d) {
return d;
});
legend.transition()
.duration(500)
.delay(function(d, i) {
return 1300 + 100 * i;
})
.style(“opacity”, “1”);
component.set(“v.showSpinner”, false);
},
generatechartdata: function(component, event, helper) {
var infolst = component.get(“v.data”);
var aMap = {};
function addValueToKey(key, value) {
aMap[key] = aMap[key] || [];
var tempArr = aMap[key];
tempArr.push(value);
aMap[key] = tempArr;
aMap[key] = _.sortBy(aMap[key], function(x) {
return x.StudentNo;
});
}
for (var i = 0; i < infolst.length; i = i + 1) {
addValueToKey(infolst[i].StudentNo, infolst[i]);
}
console.log(‘Map’ + JSON.stringify(aMap));
var studentlist = [];
var key = Object.keys(aMap);
console.log(‘Keys’ + key);
var today_date = new Date();
var today_year = today_date.getFullYear();
//console.log(today_date);
for (var i = 0; i < key.length; i = i + 1) {
var itemlist = aMap[key[i]];
var age;
var agerange;
var Sportslist = [];
_.forEach(itemlist, function(o) {
Sportslist.push(o.Sports);
});
var sports;
for (var j = 0; j < itemlist.length; j = j + 1) { var type; console.log(‘Fields’ + itemlist[j].Date); if (itemlist[j].Date !== undefined) { var dob = itemlist[j].Date.split(‘/’); } // var newdate=new Date(dob[2], dob[1] * 1 , dob[0]); age = today_year – dob[2]; console.log(‘Age’ + age); if (age >= 0 && age <= 5) { agerange = ‘0-5’; } else if (age > 5 && age <= 10) { agerange = ‘6-10′; } else if (age > 10 && age <= 15) { agerange = ’11-15’; } else if (age > 15 && age <= 18) {
agerange = ’15-18′;
}
sports = itemlist[j].Sports;
}
var Student = {
‘StudentNo’: key[i],
‘ageRange’: agerange,
‘sports’: sports,
};
studentlist.push(Student);
}
var rangelist = [‘0-5’, ‘6-10′, ’11-15′, ’15-18’];
var typelist = [‘Cricket’, ‘Football’, ‘Basketball’, ‘Hockey’];
var count = [];
var countdata = [];
var data = [];
var objdatalist = [];
var pielist = [];
for (var m = 0; m < typelist.length; m = m + 1) {
var objlist = [];
for (var n = 0; n <span data-mce-type=”bookmark” id=”mce_SELREST_start” data-mce-style=”overflow:hidden;line-height:0″ style=”overflow:hidden;line-height:0″ ></span>< rangelist.length; n = n + 1) {
// count[m]=[];
count[n] = _.filter(studentlist, function(o) {
return (o.ageRange == rangelist[n] && o.sports == typelist[m]);
})
.length;
data.push(count[n]);
var Values = {
‘agerange’: rangelist[n],
‘count’: count[n],
};
objlist.push(Values);
}
var objdata = {
‘type’: typelist[m],
‘values’: objlist
};
objdatalist.push(objdata);
countdata[m] = _.filter(studentlist, function(o) {
return (o.sports == typelist[m]);
})
.length;
var piedata = {
‘type’: typelist[m],
‘count’: countdata[m]
};
pielist.push(piedata);
}
console.log(‘Data’ + JSON.stringify(objdatalist));
this.displaydata(component, objdatalist);
this.displaypiechart(component, pielist);
},
displaypiechart: function(component, dataset) {
var pie = d3.pie()
.value(function(d) {
return d.count;
})
(dataset);
var w = 300,
h = 300;
var outerRadius = w / 2;
var innerRadius = 100;
var color = d3.scaleOrdinal()
.range([“#CD853F”, “#6A5ACD”, “#2F4F4F”, “#6B8E23”]);
var arc = d3.arc()
.outerRadius(outerRadius)
.innerRadius(innerRadius);
var svg = d3.select(‘#piechart’)
.append(“svg”)
.attr(“width”, w)
.attr(“height”, h)
.append(“g”)
.attr(“transform”, “translate(” + w / 2 + “,” + h / 2 + “)”);
var path = svg.selectAll(‘path’)
.data(pie)
.enter()
.append(‘path’)
.attr(“d”, arc)
.attr(
“fill”,
function(d, i) {
return color(d.data.type);
}
);
path.transition()
.duration(1000)
.attrTween(‘d’, function(d) {
var interpolate = d3.interpolate({
startAngle: 0,
endAngle: 0
}, d);
return function(t) {
return arc(interpolate(t));
};
});
var restOfTheData = function() {
var text = svg.selectAll(‘text’)
.data(pie)
.enter()
.append(“text”)
.transition()
.duration(200)
.attr(“transform”, function(d, i) {
return “translate(” + arc.centroid(d) + “)”;
})
.attr(“dy”, “.4em”)
.attr(“text-anchor”, “middle”)
.text(function(d) {
return d.data.count;
})
.style(
“fill”, ‘#fff’,
“font-size”, ’10px’
);
var legendRectSize = 20;
var legendSpacing = 7;
var legendHeight = legendRectSize + legendSpacing;
var legend = svg.selectAll(‘.legend’)
.data(color.domain())
.enter()
.append(‘g’)
.attr(
“transform”,
function(d, i) {
//Just a calculation for x & y position
return ‘translate(-35,’ + ((i * legendHeight) – 65) + ‘)’;
}
)
.attr(“class”, ‘legend’);
legend.append(‘rect’)
.attr(
“width”, legendRectSize
)
.
attr(“height”, legendRectSize
)
.attr(“rx”, “20”)
.attr(“ry”, “20”)
.style(
“fill”,
function(d) {
return color(d);
}
);
legend.append(‘text’)
.attr(
“x”, “30”
)
.attr(“y”, “15”)
.text(function(d) {
return d;
})
.style(
“fill”, ‘#929DAF’,
“font-size”, ’14px’
);
};
setTimeout(restOfTheData, 1000);
}
})
[/sourcecode]
Upload the same file format as shown above:
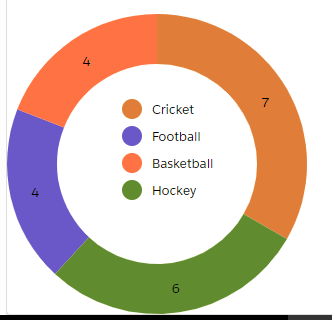
The following Donut chart will be generated. The chart below shows the count of students playing a particular sports.
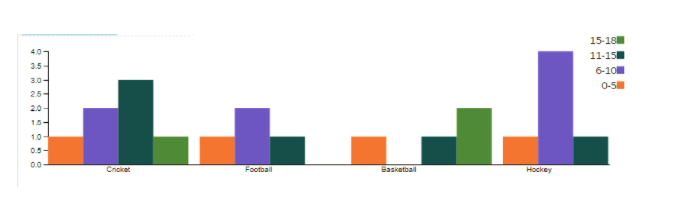
Similarly we can also generate Bar Graph similar to the chart above. The graph below depicts the number of students who play a particular sports grouped based on their age group.
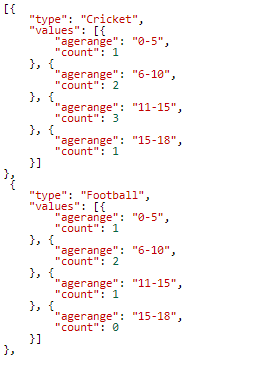
Now if we look into the code closely, you will observe that the function generatechartdata() will create a JSON object required to be passed to the d3 code to get the graph in the desired format.
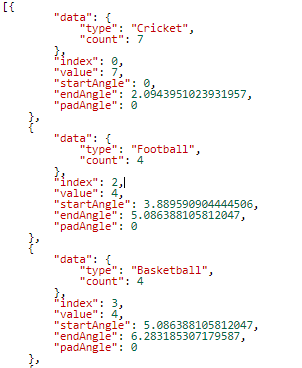
For donut chart the data generated will be similar in the form:
For Bar Graph the JSON Object generated would be in the format below:
Some of the D3 function used are:
d3.arc – Used to generate an arc for the donut chart.
d3.pie – Used to generate a pie with the JSON data returning another JSON object as shown below.
transform.translate(x, y) – Returns a transform whose translation tx1 and ty1 is equal to tx0 + x and ty0 + y, where tx0 and ty0 is this transform’s translation.
d3.legend – Is used to add a legend to the d3 chart.
For generating d3 charts of different types : https://bl.ocks.org/
For complete information about d3 functions: https://github.com/d3/d3/blob/master/API.md
Find the complete code on: https://github.com/AryaRamani/d3chartgeneration
So next time you have a functionality to generate reports in your custom lightning components, just refer to the d3.js library.