
This blog post is 3rd in the series of posts for Wave Analytics. In my previous blog post How to Create Dataset, Lens, and Dashboard in Wave Analytics, I have explained you the how to create Dataset, Lens, and Dashboard using CSV file. In this blog post, I will explain you, How to create Dataset using the Salesforce Objects.
How to create Dataset?
-
- In the Analytics app, click on the Create button and click on the Dataset.
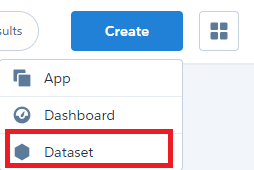
- Analytics provided the feature to pull the data from the different sources.Select Salesforce as the data source, and then click Continue.

- Now the dataset builder opens in a new Analytics tab.

- Select the object, that will be the root object and that root object will be the lowest level of the child object that you can add to the canvas.
- You can add the only parent objects of that root object, you can’t add its children objects.
- To change the root object you should refresh the page and again add the root object.
- To add the fields of that object hover the root object and click on the
 icon.Select the fields which you want to extract the data.
- If you want to add the parent objects click on the RELATIONSHIPS tab and click on the JOIN to add the related objects to the canvas.

- After clicking on the JOIN button, your canvas will look in this way.

- You can add fields and parent object relationships to that objects.
- To see the JSON code of the dataset on the left side of the panel click on the
 icon.
icon. - To remove the related object there are two options to delete the branch object.

- To delete the branch object go to the root object and hover on the root object and you will get the delete option and click on the delete button.

- The above image is the second option to delete, click on the branch object you will get the option of the Delete Branch option and click on that you will delete the object.
- Now to click on the Create Dataset button.

- Now give the Dataset Name and click on the Create button.

- In the Analytics app, click on the Create button and click on the Dataset.
- After clicking on the Create button
- Now the popup button is opened click on the Yes button you will be redirected to the Data Monitor page.

- In this page select the Dataflow View.

- On the right side of the panel click on the drop down button and click on the Start button

- The Dataflow has been started in the UI you will get the Dataflow as running state

- Click on the + icon to check the status of the Dataflow.

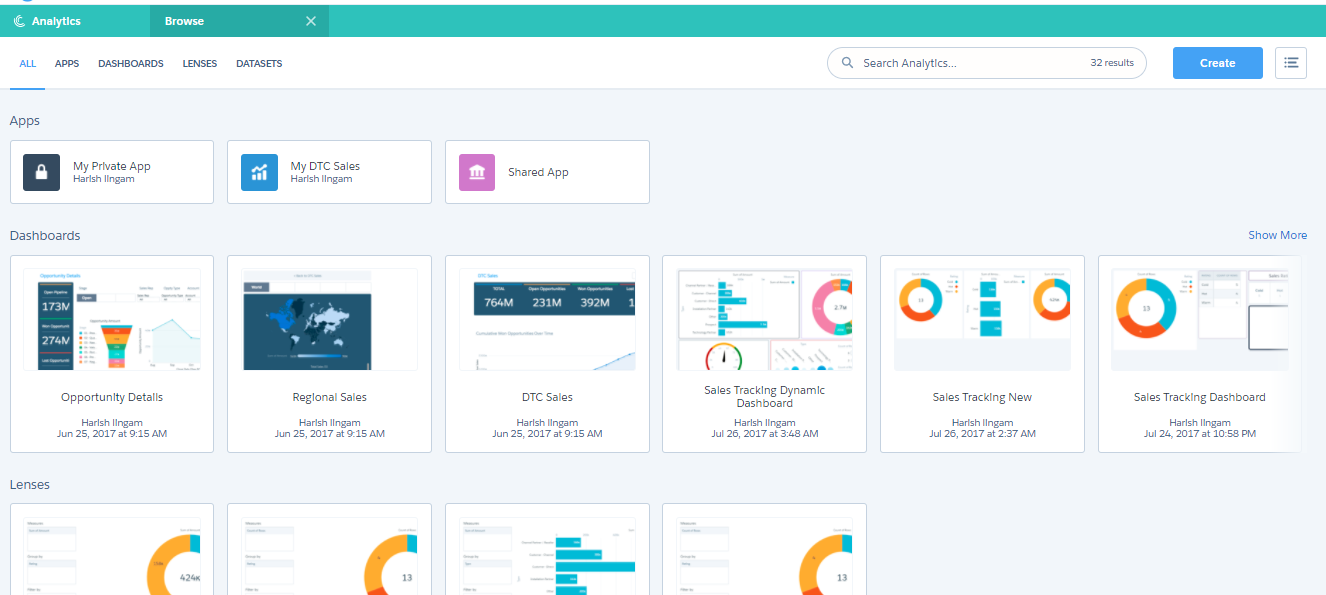
- Now navigate to the Analytics apps check the dataset has been created.
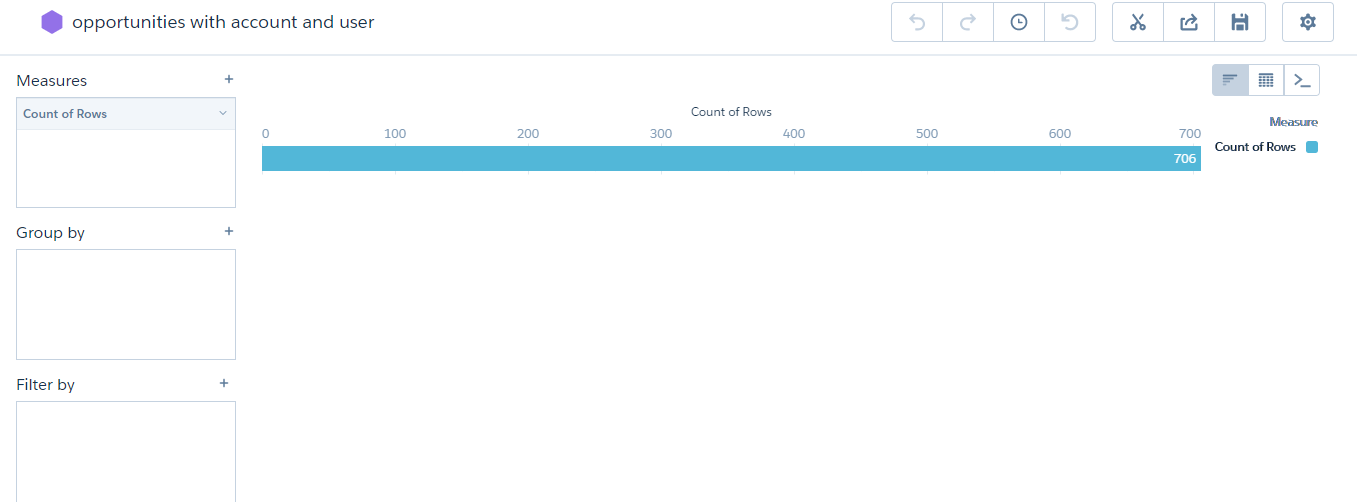
- Click on the dataset you will be redirected to the New Lens.
- Slice and Dice your Dataset with the different charts.
You can refer how to create Lens and Dashboard in my previous blog post.
If you want to know the basics of the wave analytics you can refer to first blog post of this series Basics of wave analytics
Stay tuned for my upcoming blog post where I will show you how to Create Dataset using Informatica in Wave Analytics.