In the ever-expanding universe of machine learning, few algorithms hold the mystique and power of v. A cornerstone of unsupervised learning, K-Means offers a gateway to unravelling intricate patterns and relationships within data, transforming seemingly complex datasets into organized clusters that reveal inherent structure. As we embark on a journey to demystify the enigmatic nature of K-Means clustering, we are invited into the heart of a transformative process that has shaped fields ranging from marketing segmentation to image compression. With each iteration, K-Means reveals its elegance, precision, and the uncanny ability to illuminate the hidden order within chaos. Join us as we traverse the landscape of centroids, distances, and optimization, piecing together the puzzle that is K-Means clustering and gaining insights that empower us to harness its potential in the realm of data analysis.
Introducing to the Mysteries of K-Means Clustering
In this enlightening journey, we embark on an exploration of the intricate mechanics that underpin this algorithm. By peeling back the layers, we reveal how K-Means has the remarkable ability to intricately group customers who share similar attributes into cohesive and well-defined segments.
K-Means clustering, a versatile and widely-used algorithm in the realm of machine learning, offers a profound approach to uncovering hidden structures within datasets. By delving into its inner workings and applications, we can appreciate its significance in data analysis, from customer segmentation to image compression and beyond.
How to Understand K-Means Algorithms?
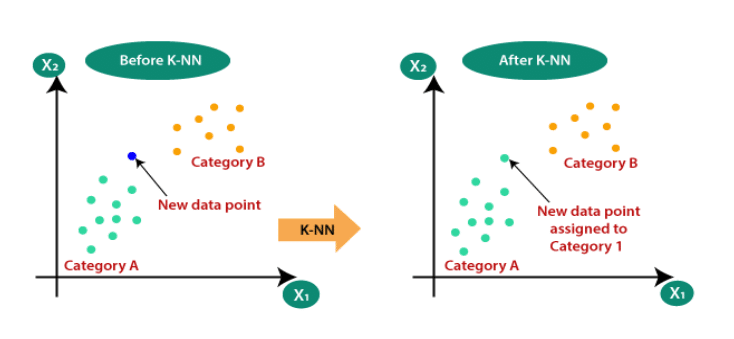
With its intuitive concept and versatile applications, k-NN has earned its place as an essential tool in the data scientist’s toolkit. At its core, the k-NN algorithm is a non-parametric and instance-based machine learning approach or lazy learning. k-Nearest Neighbors (k-NN) is a simple and intuitive machine learning technique that helps us make predictions about something by looking at how similar things are to it.
Imagine having a group of friends with diverse interests. To predict your movie preference, you ask your “k” closest friends (most similar to you) about their movie choices. Their opinions guide your decision. In k-NN, “k” signifies the friends you consult. By relying on friends who share your tastes, k-NN leverages similar examples for predictions.
What are the key components of the K-NN algorithm?
The k-Nearest Neighbors (k-NN) algorithm consists of several key components that work together to make predictions based on the similarity between data points. Here are the main components of the k-NN algorithm:
Training Data: The training data is the set of labeled examples used to build the k-NN model. Each example consists of input features and a corresponding class label (in classification) or target value (in regression).
Distance Metric: A distance metric gauges similarity or dissimilarity between data points in the feature space. The metric choice hinges on data nature and the problem. Euclidean, Manhattan, and cosine similarity are common metrics.
Hyperparameter k: The hyperparameter “k” signifies how many nearby neighbors the algorithm uses for predictions. It shapes the local influence on predictions: smaller “k” for local patterns, larger “k” for smoother boundaries.
Prediction (Classification): For predicting a new data point, k-NN computes distances between the new point and all training set points. The “k” closest neighbors are chosen via smallest distances. The most frequent class label among these neighbors is the prediction for the new point.
Prediction (Regression): For regression tasks, k-NN calculates the distances and selects the “k” nearest neighbors as in classification. The predicted value for the new data point is often the average (or weighted average) of the target values of these neighbors.
Majority Voting or Averaging: The “voting” mechanism involves selecting the class label that occurs most frequently among the “k” nearest neighbors. In regression, the algorithm calculates the average (or weighted average) of the target values of these neighbors.
Training Data: The algorithm starts with a labeled dataset, where each data point has a corresponding class label (for classification) or a numerical value (for regression).
Distance Metric: A distance metric, often Euclidean distance, is used to measure the similarity between data points in the feature space.
Parameter k: The hyperparameter k represents the number of nearest neighbors to consider when making predictions. A larger k value smoothens the decision boundaries, while a smaller k can lead to noise sensitivity.
How does K-NN work?
For understanding how K-NN works let’s consider an example to “Predict whether the patients in the “Pima Indians Diabetes Dataset ” have diabetes or not”.
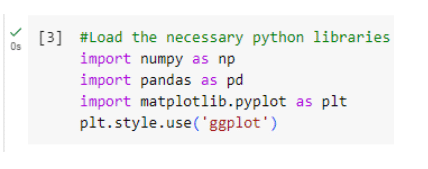
Step 1: Loading the libraries
Libraries are collections of pre-written code that provide various functions, modules, and tools to perform specific tasks. They save you time and effort by providing ready-to-use solutions for common programming challenges. Some examples of the libraries are NumPy, Pandas, TensorFlow, Keras etc.
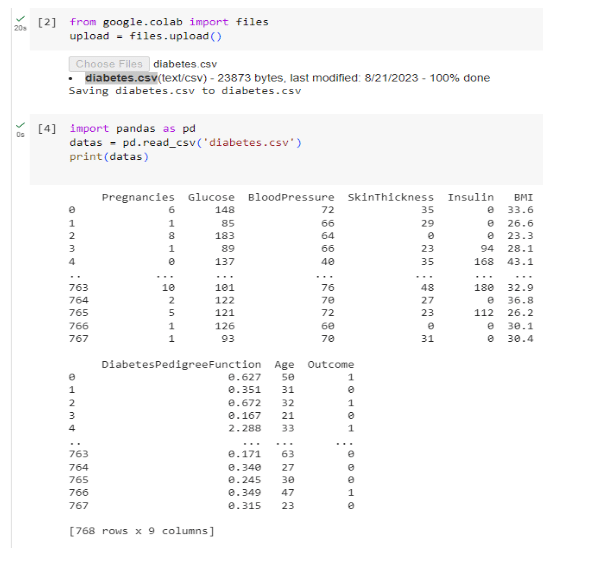
Step 2: Loading the Dataset
A dataset is an organized collection of data used for analysis, processing, modelling, and computation. It takes different forms and formats like arrays, tables, files, spreadsheets, and databases. Datasets are essential for data operations in fields like data science, machine learning, statistics, and research.
Step 3: Random of splitting the data into
Training and Testing set
Splitting a dataset into training and testing sets is a fundamental practice in machine learning and data analysis. It serves several important purposes, each contributing to building reliable and effective models. Splitting a dataset into training and testing sets allows us to evaluate a model’s performance objectively, detect overfitting, tune hyperparameters, and ensure the model’s ability to generalize to new data. It’s a critical step in building robust and reliable machine learning models.
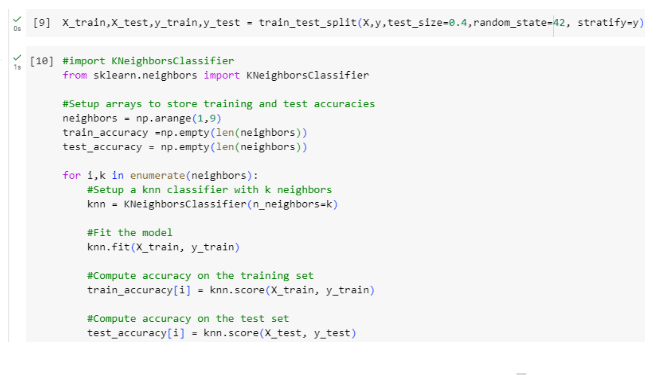
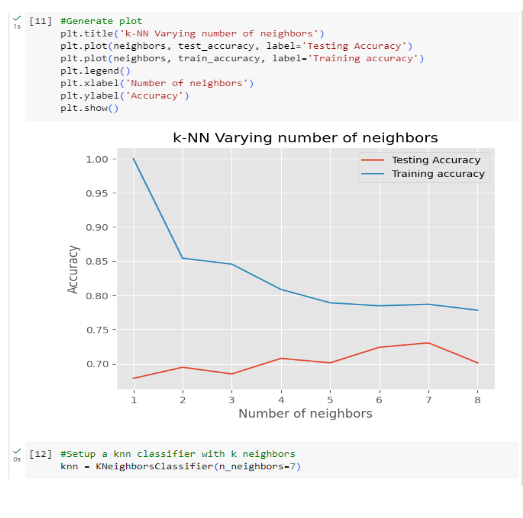
Step 4: Choosing the value for k
Picking the “k” value in k-Nearest Neighbors (k-NN) has a vital impact on its performance. “k” determines neighbor count for predictions. The choice balances bias and variance, tied to data and the problem. No universal “k” exists; it demands experimentation, cross-validation, and iteration. Unseen data evaluation and techniques like cross-validation guide optimal “k” selection for specific cases.
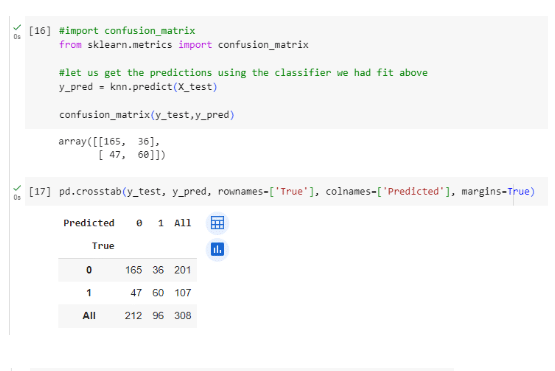
STEP 5: Creating a Confusion Matrix
A confusion matrix is a powerful tool in the field of machine learning and classification tasks that allows you to visualize the performance of a classification model by showing the actual and predicted classes for a set of data points. It provides valuable insights into how well the model is performing and where it might be making errors. The confusion matrix is especially useful when dealing with imbalanced classes or when you want to understand the types of errors your model is making.
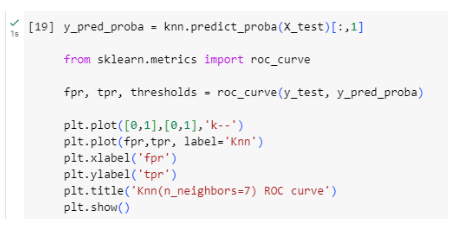
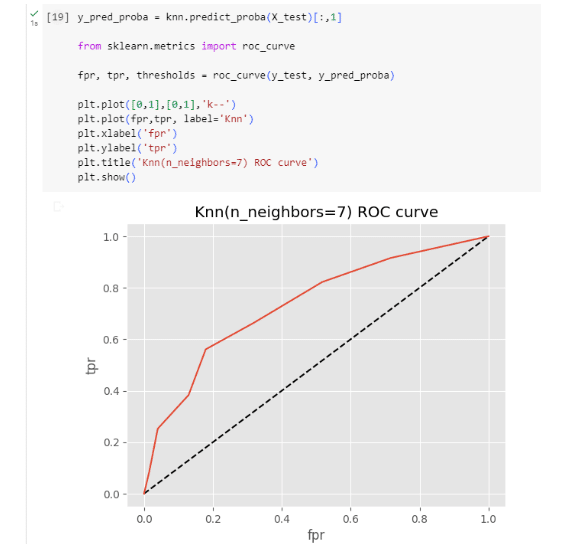
Step 6: Getting the ROC (Receiver Operating Characteristic) curve
The ROC curve portrays a binary classification model’s performance over varying discrimination thresholds. It graphs true positive rate (sensitivity) against false positive rate (1-specificity) as positive instance thresholds change. This tool assesses and compares classification models, particularly in imbalanced class distribution scenarios.
Significance of ROC Curve
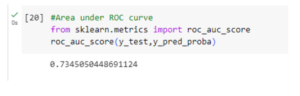
Model Comparison: The ROC curve allows you to compare the performance of multiple models. A model with a higher AUC(Area Under the Curve) is generally considered to be better at classification.
Threshold Selection: Depending on the problem’s context, you can adjust the classification threshold to prioritize sensitivity (recall) or specificity based on the ROC curve.
Imbalanced Classes: ROC curves are especially useful when dealing with imbalanced classes, where one class is much more frequent than the other. They provide a more comprehensive view of a model’s performance beyond simple accuracy.
Step 7: Cross Validation
Cross-validation is a vital technique in machine learning and data analysis. It evaluates predictive models by dividing data into subsets for systematic training and testing. This estimates performance on unseen data, addressing overfitting and variance. Crucial for model assessment and selection, cross-validation ensures reliable and representative performance estimates for generalization to new data.
We employ K-Fold Cross Validation, where the original sample splits into k equal subsamples. One subsample is validation data, the rest (k-1) are for training. This repeats k times, each subsample being validation once. Results from folds average to yield an estimation.
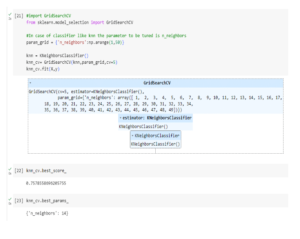
Step 8: Hyperparameter tuning
Hyperparameter tuning, also known as hyperparameter optimization or hyperparameter search, is the process of systematically searching for the best combination of hyperparameters for a machine learning model. Hyperparameters are settings that control the behaviour of the model and affect its performance and generalization. Unlike model parameters, which are learned from the data (e.g., weights in neural networks), hyperparameters are set by the user before training the model.
Strengths of k-NN
Simplicity: k-NN is easy to understand and implement, making it a great choice for beginners in machine learning.
Flexibility: It can handle both classification and regression tasks, and it adapts well to changes in the data distribution.
No Model Assumption: k-NN doesn’t make assumptions about the underlying data distribution, which can be an advantage in scenarios where the data is complex or not well understood.
Interpretable: The predictions of k-NN can be easily interpreted, as they are based on the actual instances in the dataset.
Conclusion
The k-Nearest Neighbors algorithm stands as a testament to the power of simplicity in machine learning. Its ability to make predictions based on local similarity has led to its success in a variety of applications, from image classification to recommendation systems. While k-NN has its limitations, its strengths and intuitive nature make it a valuable tool for understanding the fundamental concepts of machine learning and exploring the intricate relationships within data. As you embark on your machine learning journey, keep in mind that sometimes the simplest algorithms can yield impressive results.
References
- https://www.javatpoint.com/k-means-clustering-algorithm-in-machine-learning
- https://www.analyticsvidhya.com/blog/2019/08/comprehensive-guide-k-means-clustering/
- https://www.geeksforgeeks.org/k-means-clustering-introduction/
- https://towardsdatascience.com/understanding-k-means-clustering-in-machine-learning-6a6e67336aa1