For example, user wants to see the list of opportunity stages by opportunity count. Hence, to show all the opportunity stages even if the count is zero, we need to use a static csv file containing opportunities stages data. The static csv file we are using here contains following data related to opportunity stages.
Create a Dataset
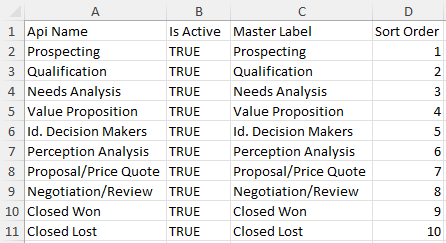
Upload the csv file that holds the picklist values as opportunity stages and create a dataset OpportunityStages.
Create a Dashboard
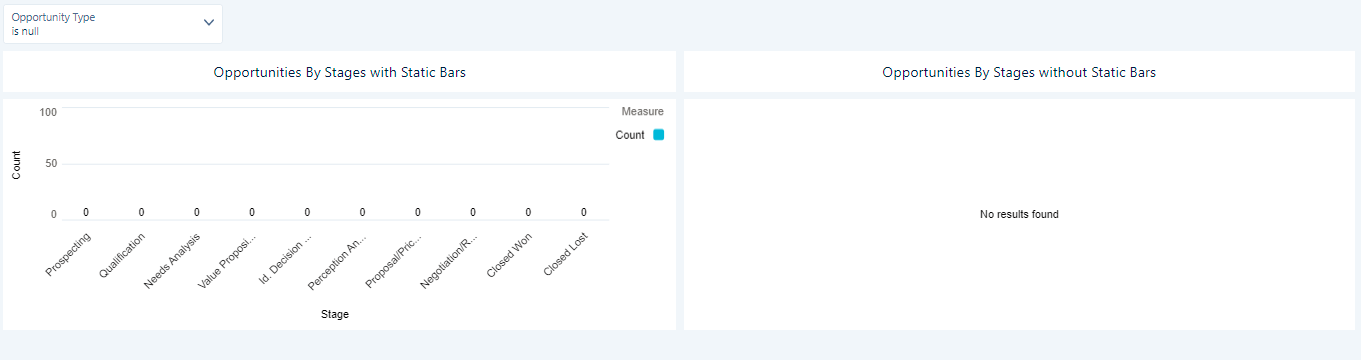
The dashboard contains a filter Opportunity Type and charts to show Opportunities By Stages with Static Bars even when the values are zero in the chart for respective opportunity stages and Opportunities By Stages without Static Bars.
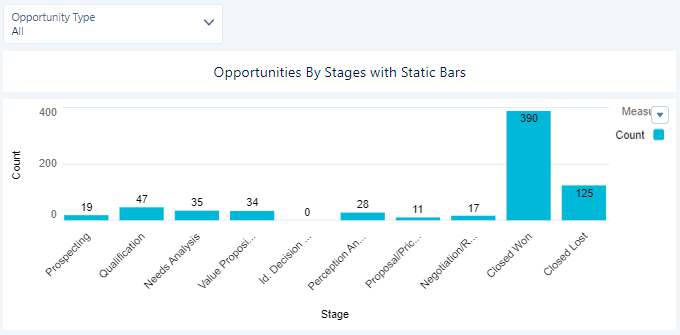
Opportunities By Stages with Static Bars:
Load the dataset Opportunities_Dataset and OpportunityStages. This chart we use a co-group statement to combine both the datasets and use coalesce to replace opportunities stage bars with default zero value. To show in an order, custom sorting is additionally added to the query.
# SAQL code for the above chart
q = load \”Opportunities_Dataset\”;
s = load \”OpportunityStages\”;
s = foreach s generate \’Api_Name\’ as \’Api_Name\’, \’Sort_Order\’ as \’Sort_Order\’, 0 as \’Count\’;
br = cogroup q by (\’StageName\’) full, s by (\’Api_Name\’);
br = foreach br generate coalesce(q.\’StageName\’, s.\’Api_Name\’) as \’StageName\’, count(q) as \’Count\’, max(s.\’Sort_Order\’) as \’SortOrder\’;
br = order br by \’SortOrder\’;
br = foreach br generate \’StageName\’ as \’StageName\’, \’Count\’ as \’Count\’;
br = limit br 100000;
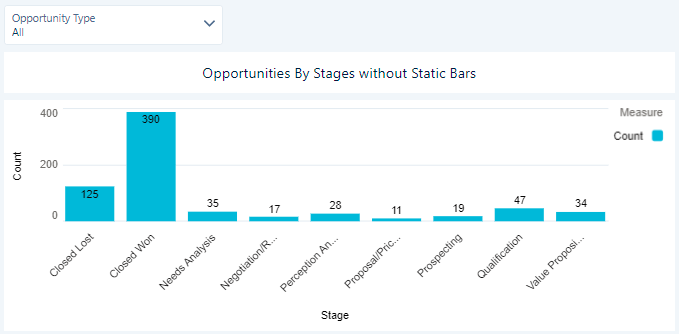
Opportunities By Stages without Static Bars:
The chart directly shows the count of opportunities by stages using Opportunities_Dataset. This chart does not show opportunity stages bar with zero value.
# SAQL code for the above chart
q = load \”Opportunities_Dataset\”;
q = group q by \’StageName\’;
q = foreach q generate \’StageName\’ as \’StageName\’, count(q) as \’Count\’;
q = limit q 100000;
Comparing the two charts closely, you can see the output difference. Id Decision Makers picklist value is not present in the right hand side chart because the values is zero.
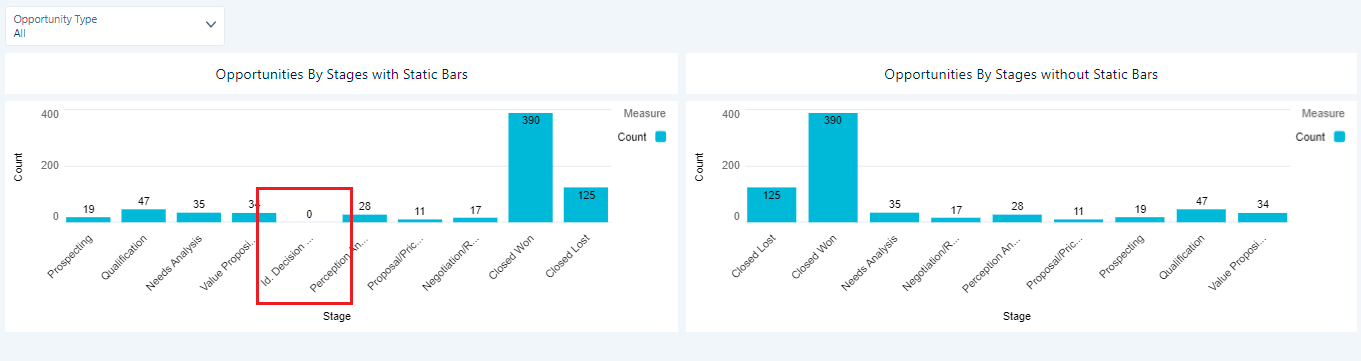
Also, the bar values are still shown even when the values are zero as shown below.